
NVIDIA GeForce GTX 660 Shootout - True Mid-range Kepler
NVIDIA's GeForce GTX 660 is its first true mid-range Kepler card and features a brand new GK106 core. Priced at an attractive US$229, NVIDIA claims that this card offers the best price-performance ratio out of the entire Kepler series. We take it for a test drive as well as custom models from ASUS, Gigabyte and MSI.
Is This The Card You've Been Waiting For?
Last month, NVIDIA released the first of its long-awaited mid-range Kepler graphics cards, the NVIDIA GeForce GTX 660 Ti. While it scored well, it was priced slightly higher than anticipated (especially in this region) due to its use of the high-end GK104 GPU core (the same found in NVIDIA's GTX 670 and flagship GTX 680 models). From our testing, it turned out to have performance much more in common with a high-end part than a mid-range one that many were hoping it would be.
Today, NVIDIA releases its GeForce GTX 650 and the card many people have been waiting for - the GTX 660. This is a card that can be considered as NVIDIA's first true mid-range performance Kepler card, as it will be utilizing a brand new GPU core, designed especially for it: GK106.
While the GTX 660 is using a new core, it still retains full Kepler capabilities, which includes NVIDIA's GPU Boost, a technology that dynamically adjusts a GPU's clock speed according to its current operating environment. At a very affordable US$229, NVIDIA is pushing the GTX 660 as the Kepler card for everyone, citing its strong price/performance ratio and likening it to the NVIDIA 8800 GT/9800GT, one of the more popular cards from 2007/2008 era. According to data collected by NVIDIA on Steam, these old cards are still used by about 53% of NVIDIA users today.
If you're one of these gamers, the question you're probably asking is: is this the card you've been waiting for?
Meet the NVIDIA GeForce GTX 660

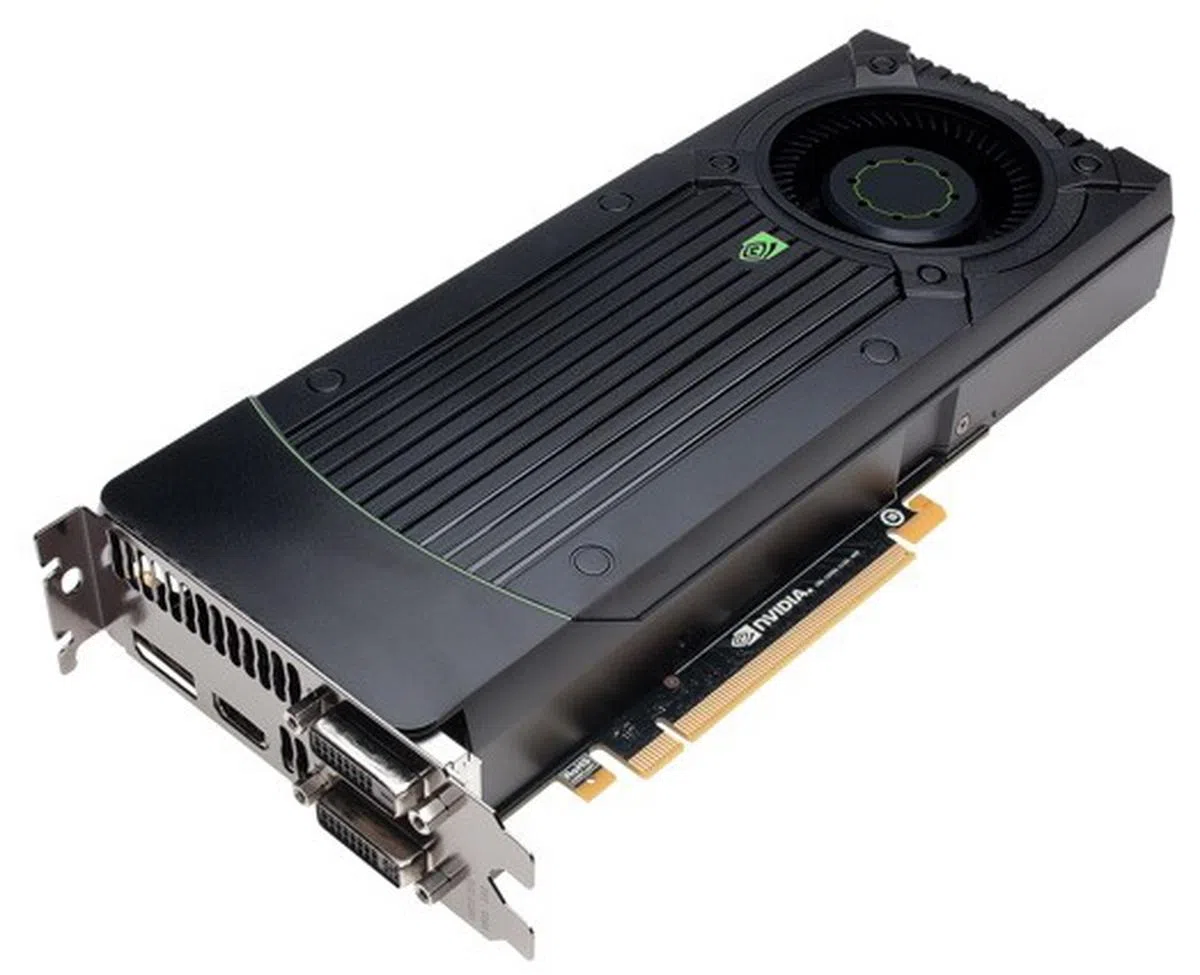
The GeForce GTX 660 is the first performance oriented Kepler card not to use the GK104 core, instead it uses a completely new GK106 core.
The GeForce GTX 660 utilizes 2.54 billion transistors packed into 960 CUDA cores, with a default clock speed of 980MHz. The memory subsystem consists of three 64-bit memory controllers (for a total memory bus width of 192 bits) with 2GB of GDDR5 memory, clocked at a default 6008MHz DDR and sustaining a bandwidth of 144.2GB/s. There are 80 Texture Mapping Units and 24 Raster Operator Units.
Compared to the GTX 660 Ti, you can see that while they share the same number designation, they're actually very different cards: the GTX 660 has 1 billion less transistors, 384 less CUDA Cores, and 32 less Texture Mapping Units. With these reductions, its power requirements are lower and only requires a single 6-pin Molex PCIe power connector for operation.
Display outputs on the GTX 660 follow the same pattern as all of NVIDIA's other Kepler cards, consisting of one DVI-I port, one DVI-D port, one HDMI port, and one DisplayPort port. Together, they allow the card to support four monitors simultaneously with 3D Vision Surround support from just a single GPU (one of the promises of the Kepler based GPUs).
Against the red camp, pricing on the GTX 660 puts it squarely in competition with AMD's Radeon HD 7850, which has a revised RSP of US$239.
Here’s a quick look at how the GeForce GTX 660 compares against the rest of its competitors.
Model | NVIDIA GeForce GTX 660 | NVIDIA GeForce GTX 660 Ti | AMD Radeon HD 7850 | AMDRadeon HD 7870 | AMDRadeon HD 7950 | NVIDIA GeForce GTX 580 | NVIDIA GeForce GTX 560 Ti |
Core Code | GK106 | GK104 | Pitcairn Pro | Pitcairn XT | Tahiti Pro | GF110 | GF104 |
Transistor Count | 2.54 Billion | 3.54 Billion | 2.8 Billion | 2.8 Billion | 4.3 Billion | 3 Billion | 1.95 Billion |
Manufacturing Process | 28nm | 28nm | 28nm | 28nm | 28nm | 40nm | 40nm |
Core Clock | 980MHz | 915MHz | 860MHz | 1000MHz | 800MHz | 772MHz | 822MHz |
Stream Processors | 960 Stream processing units | 1344 Stream processing units | 1024 Stream processing units | 1280 Stream processing units | 1792 Stream processing units | 512 Stream processing units | 384Stream processing units |
Stream Processor Clock | 980MHz | 915MHz | 860MHz | 1000MHz | 800MHz | 1544MHz | 1644MHz |
Texture Mapping Units (TMU) or Texture Filtering (TF) units | 80 | 112 | 64 | 80 | 112 | 64 | 64 |
Raster Operator units (ROP) | 24 | 24 | 32 | 32 | 32 | 48 | 32 |
Memory Clock | 6008MHz GDDR5 | 6008MHz GDDR5 | 4800MHz GDDR5 | 4800MHz GDDR5 | 5000MHz GDDR5 | 4000MHz GDDR5 | 4008MHz GDDR5 |
DDR Memory Bus | 192-bit | 192-bit | 256-bit | 256-bit | 384-bit | 384-bit | 256-bit |
Memory Bandwidth | 144.2GB/s | 144.2GB/s | 153.6GB/s | 153.6GB/s | 240GB/s | 192.4GB/s | 128GB/s |
PCI Express Interface | PCIe ver 3.0 x16 | PCIe ver 3.0 x16 | PCIe ver 3.0 x16 | PCIe ver 3.0 x16 | PCIe ver 3.0 x16 | PCIe ver 2.0 x16 | PCIe ver 2.0 x16 |
Molex Power Connectors | 1 x 6-pin | 2 x 6-pin | 1 x 6-pin | 2 x 6-pin | 2 x 6-pin | 1 x 6-pin, 1 x 8-pin | 2 x 6-pin |
Multi GPU Technology | SLI | SLI | CrossFireX | CrossFireX | CrossFireX | SLI | SLI |
DVI Output Support | 2 x Dual-Link | 2 x Dual-Link | 1 x Dual-Link | 1 x Dual-Link | 2 x Dual-Link | 2 x Dual-Link | 2 x Dual-Link |
HDMI | 1 | 1 | 1 | 1 | 1 | 1 (mini-HDMI) | 1 (mini-HDMI) |
DisplayPort | 1 (version 1.2) | 1(version 1.2) | 1 (version 1.2 HBR2) | 1 (version 1.2 HBR2) | 2 (version 1.2 HBR2) | None | None |
HDCP Output Support | Yes | Yes | Yes | Yes | Yes | Yes | Yes |
Street Price | Launch Price: US$229 | Launch Price: US$299 | Current Price: US$239 | Current Price: US$299 | Current Price: US$349 | Current Price: US$379 | Current Price: US$199 |
Meet the Custom Cards
As with the GTX 660 Ti, almost all of NVIDIA's add-in partners are expected to produce their own custom version of this card, and in many cases, you can expect multiple versions of differing specifications and price. We've managed to get our hands on three of the earliest to launch custom models from the big three of PC components: ASUS, Gigabyte and MSI. Others like Palit, Galaxy and Zotac will follow and we'll bring you coverage of those in the near future.

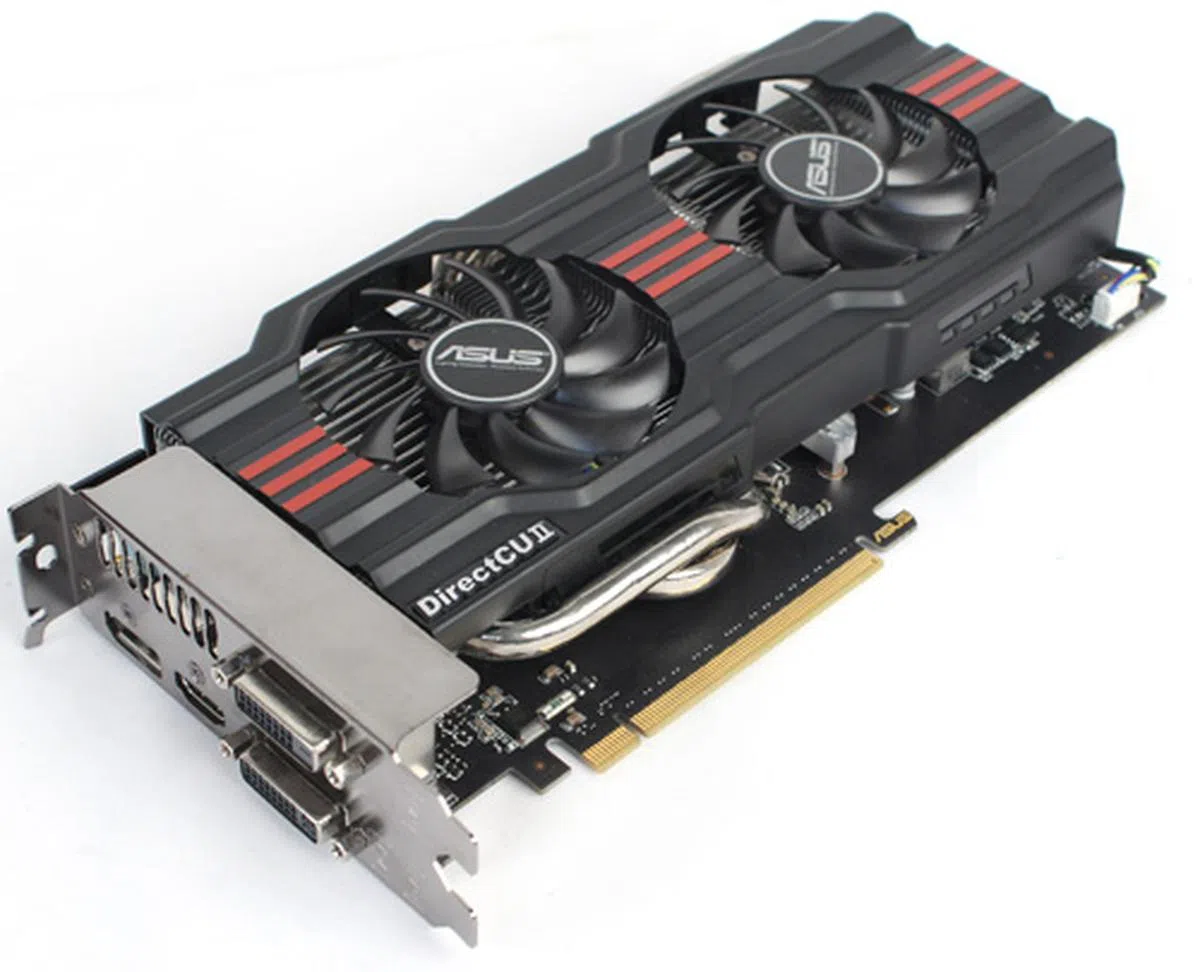
ASUS GeForce GTX 660 DirectCU II TOP 2GB GDDR5


As with ASUS' GTX 660 Ti, ASUS once again holds the distinction of having the highest overclocked GTX 660, with its DirectCU II TOP model raised from 980MHz all the way up to 1072MHz. Memory speeds have also been given a small boost, up to 6108MHz DDR. Like most of ASUS' custom cards, it uses the popular dual-fan DirectCU II cooling system. This particular model utilizes three nickel-plated copper heatsink pipes in direct contact with the GPU, connected to an array of cooling fins, and ventilated by two fans.
ASUS actually makes three variants of the GTX 660 Direct CU II. The TOP model we're reviewing retails for S$409. For S$10 less, a DirectCU II OC edition, which has a lower core overclock of 1020MHz, but is otherwise identical, retails for S$399, while the non-OC DirectCU II version which uses default clock speeds, sells for S$390. All versions come with a 3-year replacement warranty period.

The ASUS GeForce GTX 660 is the largest of our cards, measuring 267 x 145 x 35mm. It's still quite compact though, and easily fits within two slots.

ASUS uses a custom PCB with upgraded components.

Ports are the same as stock, with one DVI-I, one DVI-D, one HDMI port, and one DisplayPort port. Like all other cards, it uses one 6-pin Molex PCIe power connector (though it's not visible from these photos).
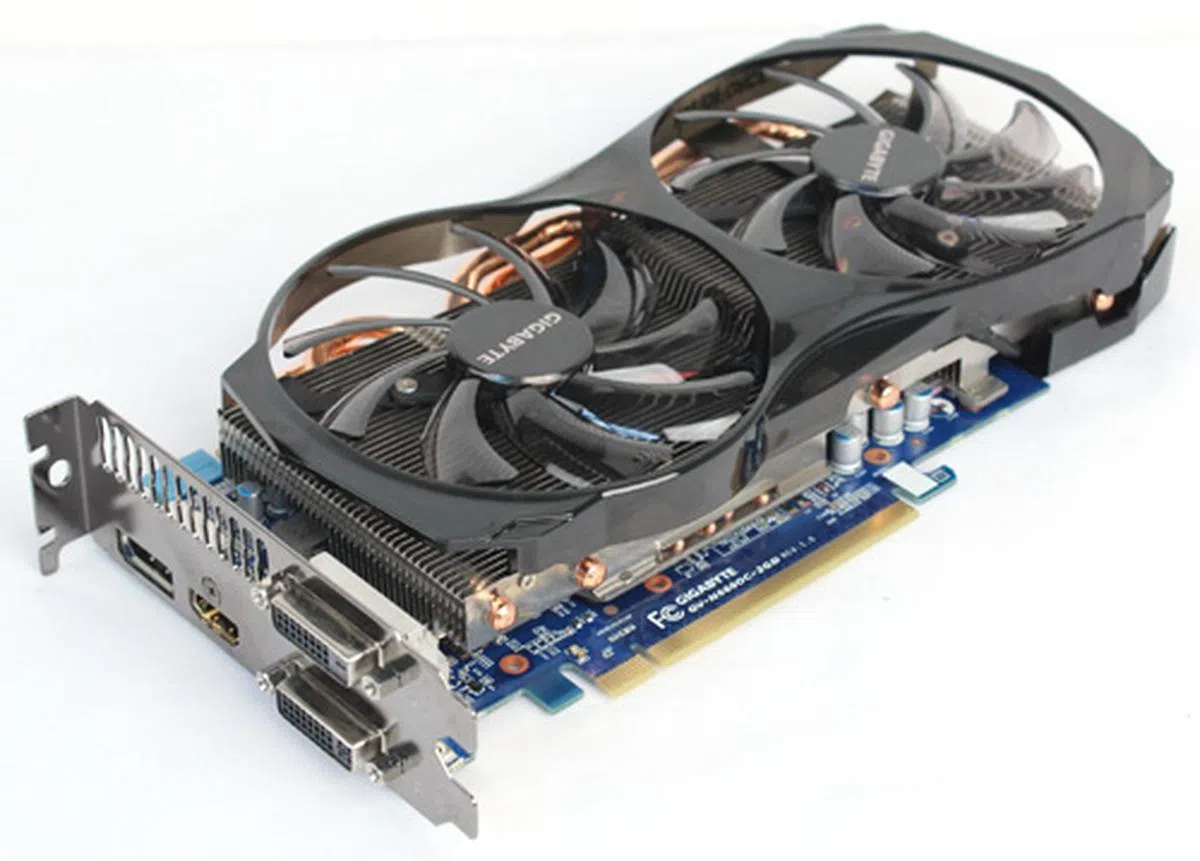
Gigabyte GeForce GTX 660 Windforce OC 2GB GDDR5


Gigabyte's GeForce GTX 660 has been overclocked to 1033MHz on the core, with memory remaining at the default 6008MHz DDR.
Gigabyte's model uses the same 'open design' as its GTX 660 Ti, with a very minimal fan shroud. A good fan shroud is usually designed to improve air flow direction, however, it may not always be necessary and, in fact, combined with good chassis air flow, GPU temperatures may actually be lower without one. Additionally, Gigabyte's model compensates somewhat by using 100mm fans, much larger than our other two custom models. We'll find out later in the review if this design helped it garner better operating temperatures.
Under the fans, four 6mm copper heatpipes are connected to two heatsinks, one directly over the GPU, and one elevated to the side.
This model retails for a very affordable S$345 and is issued with a 3-year warranty period.

Gigabyte's GTX 660 is quite compact thanks to its minimal fan shroud, measuring 255x 135 x 35mm

Gigabyte uses a custom PCB with upgraded components.

Port layout is the same as reference card with one DVI-I port, one DVI-D port, one HDMI port, and one DisplayPort port. It is powered by one 6-pin PCIe Molex connector too.
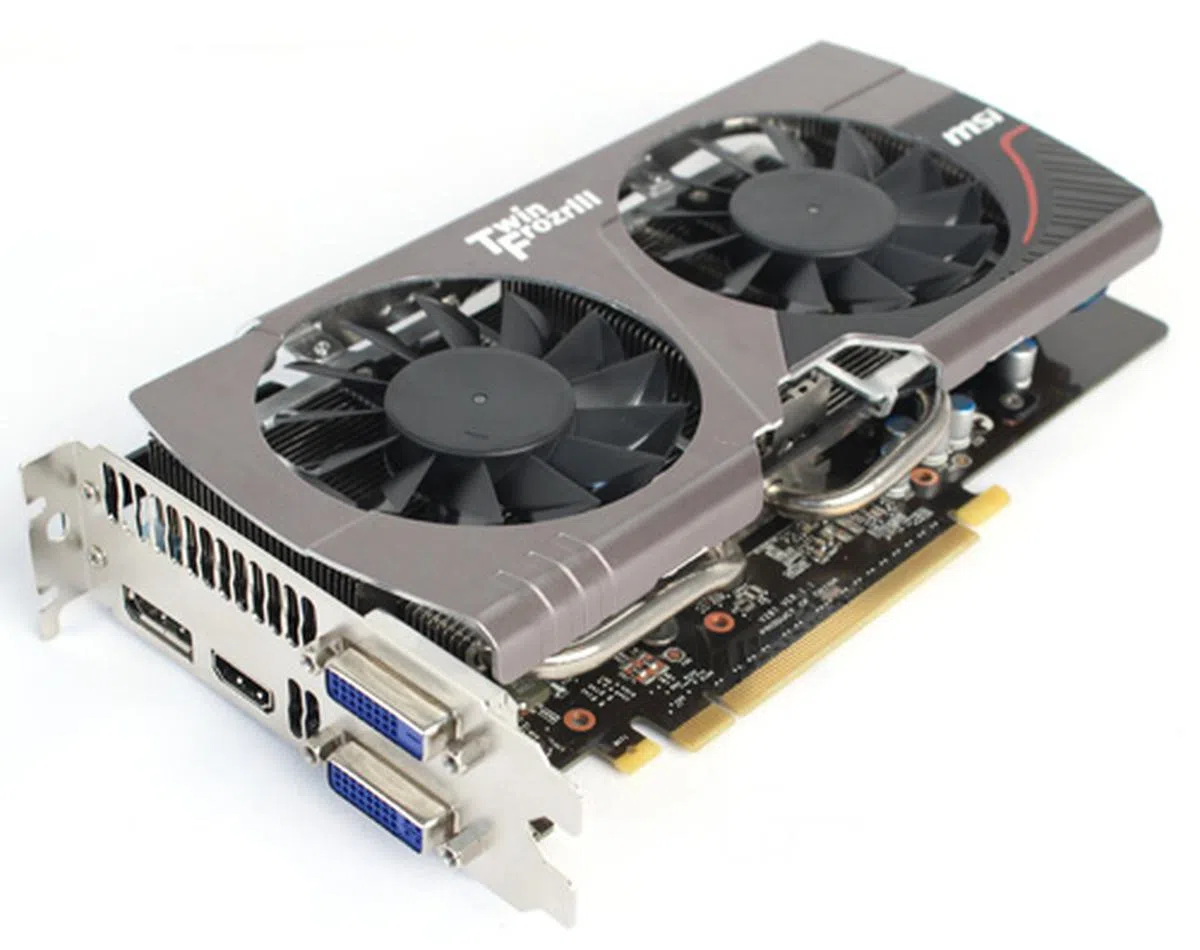
MSI GeForce GTX 660 Twin Frozr III OC 2GB GDDR5


MSI's GeForce GTX 660 is very similar in spec to Gigabyte's, with core clock speeds ramped up to the same 1033MHz and memory remaining at the default 6008MHz DDR. This model uses MSI's Twin Frozr III cooler, consisting of three large, nickel-plated, copper heatpipes and a large cooling fin array connected to two heatsinks, one heatsink directly over the GPU and another that covers the memory chip and voltage regulation circuitry. Two 'propeller fans', so named for their tight 13-blade array, and designed for increased airflow, keep everything ventilated.
The MSI GeForce GTX 660 Twin Frozr III OC retails for S$389 and comes with a three-year warranty.

The MSI GTX 660 is the smallest card in our shootout, measuring 235 x 137 x 37mm

Like ASUS and Gigabyte, MSI uses a custom PCB with upgraded components.

Port layout is the same as the reference card with one DVI-I port, one DVI-D port, one HDMI port, and one DisplayPort port. Like the reference card, it uses one 6-pin Molex PCIe power connector.
Test Setup
As usual, the following are the specs of our trusty graphics card test bed system:
- Intel Core i7-975 (3.33GHz)
- Gigabyte GA-EX58-UD4P motherboard
- 3 x 1GB DDR3-1333 G.Skill memory in triple channel mode
- Seagate 7200.10 200GB SATA hard drive
- Windows 7 Ultimate 64-bit
The list of benchmarks used:
- Futuremark 3DMark 11
- Unigine v2.1 "Heaven"
- Futuremark 3DMark Vantage
- Far Cry 2
- Crysis Warhead
- Battlefield: Bad Company 2
- Crysis 2
- Batman: Arkham City
- Dirt 3
- S.T.A.L.K.E.R.: Call of Pripyat
The list of cards tested and drivers used:
- NVIDIA GeForce GTX 660 2GB GDDR5 (ForceWare 306.23)
- NVIDIA GeForce GTX 660 Ti 2GB GDDR5 (ForceWare 305.37)
- ASUS GeForce GTX 660 DirectCU II TOP 2GB GDDR5 (ForceWare 306.23)
- Gigabyte GeForce GTX 660 Windforce OC 2GB GDDR5 (ForceWare 306.23)
- MSI GeForce GTX 660 Twin Frozr III OC 2GB GDDR5 (ForceWare 306.23)
- AMD Radeon HD 7870 2GB GDDR5 (AMD Catalyst 12.8)
- AMD Radeon HD 7950 2GB GDDR5 (AMD Catalyst 12.2 Preview Version)
- NVIDIA GeForce GTX 580 2GB GDDR5 (ForceWare 280.26)
- NVIDIA GeForce GTX 560 Ti 1GB GDDR5 (ForceWare 305.37)
- NVIDIA GeForce GTX 460 Ti 1GB GDDR5 (ForceWare 305.37)
- NVIDIA GeForce 9800 GT 1GB (ForceWare 305.37)
* Update as of 14/09/12, 1.15am: We acknowledge the fact that the AMD results reported use a pretty old driver set and we'll be updating the results soon. Comparisons with the rest of the NVIDIA cards are still valid *
* Update as of 14/09/12, 7.30pm: We've revised the the AMD Catalyst driver version to 12.8 for the Radeon HD 7870, but overall performance doesn't differ much.
Test Setup Notes:
- As was the case with the NVIDIA GeForce GTX 660 Ti, no reference model was available from NVIDIA for this shootout, as such we have downclocked one of our custom cards to reference spec, which should give you an idea for how it would perform if you were to get a reference model GeForce GTX 660 Ti graphics card.
- While most of our benchmarks are run on DX11, we've thrown in a page of older DX10 compatible tests which include NVIDIA's 9800 GT, for the 53% of NVIDIA card users out there still using this card. This should give you an idea of how much of an upgrade you can expect going from the 9800 GT to the GTX 660. NVIDIA's 9800 GT was available in a number of different specs, with either 512MB or 1GB memory being the most significant difference. We have chosen the 1GB version as our tests are run on 1920 x 1200 and 2560 x 1600 resolutions, where 512MB memory would be insufficient. The actual card in question is MSI's GeForce N9800GT-MD1G (an eco-oriented card), overclocked to reference specs of a standard GeForce 9800 GT.
- While AMD's Radeon HD 7850 is the direct competitor for the GeForce GTX 660, unfortunately, it was not available for our shootout, and as such we have replaced it with the higher end Radeon HD 7870, a card that is priced US$50 more. However as you'll soon see in the following pages, the Radeon HD 7870 is the ideal direct competitor for the new GeForce GTX 660.
For summary, here's a comparison of the GTX 660 cards tested, showing core and memory clock speeds, as well as current pricing.
Graphics Card | Core Clock Speed | Memory Clock Speed | Price |
ASUS GeForce GTX 660 DirectCU II TOP 2GB GDDR5 | 1072MHz | 6108MHz DDR | S$409 |
Gigabyte GeForce GTX 660 Windforce 2GB GDDR5 | 1033MHz | 6008MHz DDR | S$345 |
MSI GeForce GTX 660 Twin Frozr III OC 2GB GDDR5 | 1033MHz | 6008MHz DDR | S$389 |
NVIDIA GeForce GTX 660 2GB GDDR5 | 980MHz | 6008MHz DDR | US$229 |
3DMark 11 Results
3DMark 11 is a synthetic benchmark designed to test a GPU's performance at various aspects of DirectX 11 such as tessellation and DirectCompute.
The GTX 660 performed fairly well overall. While the difference between the 660 and 660 Ti was immediately obvious - with the 660 lagging behind by about 20% - the GTX 660 was still able to outperform its competitors from AMD. In fact, despite having to replace its direct competitor the Radeon HD 7850 with the higher end HD 7870, the GTX 660 still managed to beat the higher-end model, and actually was very competitive with the even higher HD 7950, which is the second highest card in AMD's Graphics Core Next lineup.
Compared to the older GTX 560 Ti, the GTX 660 showed a 38% increase in performance, and a massive 83% performance increase against the older GTX 460.

If we take a look at the 660's GPU Boost performance on 3DMark 11's Extreme setting, we can see that it achieved a peak core clock speed of 1084MHz , just over 100MHz higher than the default clock speed, which is in line with the performance boost we have come to expect from other Kepler reference cards showing that the GK106 core is indeed a full-featured Kepler GPU.

As for our custom cards, ASUS' higher core and memory clock speeds gave it an advantage, performing about 6% better than the reference design, while MSI performed about 4% better, and Gigabyte about 3% better. If we look at the GPU Boost speeds for each, we can see that MSI's slightly better performance is due to a higher GPU Boost, peaking at 1137MHz, 104MHz above its default speed, while Gigabyte peaked at 1124MHz, 91MHz above its default speed. ASUS recorded the same GPU Boost as Gigabyte, 91MHz higher than its default speed, which, when added to its higher default clock speed, gave it a peak core clock of 1163MHz.

ASUS GeForce GTX 660 DirectCU II TOP

Gigabyte GeForce GTX 660 Windforce OC

MSI GeForce GTX 660 Twin Frozr III OC
Unigine 2.1 "Heaven" Results
On the synthetic Unigine 2.1 benchmark, the GTX 660 struggled slightly, and was outperformed by the AMD Radeon HD 7870 by between 6-20%. This wasn't entirely unexpected, due to the lower number of stream processing units (CUDA Cores) on the GTX 660 being insufficient at handling the amount of advanced ambient occlusion and tessellation occurring in this test.
Comparing across the custom cards, ASUS stayed in the lead, with MSI again performing slightly better then Gigabyte at no AA, while at 8x AA, both performed within 0.5% of each other.


3DMark Vantage
What a difference four years makes. Against last year's GTX 560 Ti, the GTX 660 posted a 43% improvement on 3DMark Vantage's Extreme setting. Going back another year, the GTX 660 was over twice as good against the GTX 460, while it was an amazing five times better than the 9800 GT.
For our custom cards, we saw the exact same pattern as before, proving that GPU Boost works as effectively on DX10 as it does on DX11.

Far Cry 2
In Far Cry 2, the GTX 660 was once again able to outperform its competitors from AMD and this time was also within reach of the GTX 660 Ti.
As for the older cards, just like what we saw with 3DMark Vantage, the 660 GTX scored five times better the 9800 GT, which, even at our lowest resolution of 1920 x 1200 pixels, was just barely playable at Ultra settings with 4x AA, at 30.2 FPS. At higher resolutions and settings, the 9800 GT was completely unusable.


Crysis Warhead Results
Crysis Warhead is one of the more taxing DX10 engine games out there, as it features a fairly heavy amount of tessellation. As was the case with Unigine 2.1, the GTX 660 once again struggled and fell behind the AMD Radeon HD 7870 due to this, although the difference wasn't that large, with only about 5-6% between them.
The old GeForce 9800 GT was completely unplayable at all settings, with the GTX 660 scoring about four times better across the board.


Battlefield: Bad Company 2 Results
The GTX 660 excelled at this DX11 game. While it may be getting a bit old, Battlefield: Bad Company 2's Frostbite 1.5 engine is still a good test of a GPU’s geometry shading power. Impressively, the GTX 660 managed to beat both the HD 7870, and also the higher-end HD 7950, scoring more than 12% better than the latter at 1920 x 1200, and more than 6% better at the 2560 x 1600 pixels resolution.
For the custom cards, ASUS was once again on top, but surprisingly MSI fell slightly behind at the 1920 x 1200 resolution, and scored almost exactly the same as Gigabyte at 2560 x 1600.

Crysis 2 Results
Much like its predecessor, Crysis 2 requires a beast of a machine to run smoothly at the highest resolutions. Its Ultra High setting puts GPUs through their paces with a grueling test of tessellation, Parallax Occlusion Mapping, water rendering, and particle motion blur and shadowing.
As we've come to expect from benchmarks with high tessellation, the GTX 660 did not fare quite as well as the AMD contenders. However it was still within striking distance, falling behind by only 3% on 1920 x 1200, and by about 10% on 2560 x 1600. While these numbers may seem high, in terms of actual tangible FPS, the difference was very small, with only about 1 FPS difference between them.
Our custom cards showed the same pattern as before, however, we didn't see as big an improvement, with ASUS leading the way but with only a 2% improvement on the reference score.

*Updated as of 14/09/12, 7.30pm: This is the only page where the new AMD Catalyst 12.8 drivers made any difference to performance of the Radeon HD 7870. Still, the outcome is no different and doesn't change any of our previous findings.
Batman: Arkham City Results
Arkham City is optimized for NVIDIA PhysX optimization and as expected, all NVIDIA cards outperformed AMD. The GTX 660 performed quite well here, scoring behind the 660 Ti by about 17%. The strange results that you notice in the graph where the Radeon HD 7870 outperforming the Radeon HD 7950 was a direct result of different driver editions used. For the purpose of this article (and for the sake of time), we've updated results only for the Radeon HD 7870 to the latest available driver edition (Catalyst 12.8). This gave the AMD counterpart a good boost in results, but it was still some ways behind the NVIDIA cards.
Wit regards to the shootout contenders, all three custom cards performed identically, but only outperformed the reference design by 2%.

Dirt 3 Results
The GTX 660 put in another solid performance in Dirt 3, again beating both AMD cards, outscoring the HD 7870 by about 2%. Again, the disparity witnessed here between the two AMD cards is due to the improved frame rates that the Radeon HD 7870 churned out after we updated its graphics drivers to the latest version (Catalyst 12.8). We do expect to use similar improvements to the AMD Radeon HD 7900 cards with the new AMD Catalyst drivers, pending our updated test results. Our custom GeForce GTX 660 cards also performed better, with ASUS outscoring the reference design by 3% at 1920 x 1200, and 6% at 2560 x 1600. There wasn't anything to separate Gigabyte and MSI, with both about 0.5% behind ASUS at both resolutions.

S.T.A.L.K.E.R.: Call of Pripyat Results
Performance for the GTX 660 on S.T.A.L.K.E.R.: Call of Pripyat was fairly close to AMD's Radeon HD 7870, with the exception of the 1920 x 1200 resolution, No AA, Day Run, where the GTX 660 was able to score a significant win.
For the most part, the GTX 660 was better than the HD 7870 at 1920 x 1200 resolution, while the HD 7870 caught up and slightly outscored it at the 2560 x 1650 resolution, with the exception when anti-aliasing was turned off, i.e., No AA.
For our custom cards, ASUS maintained a small lead of about 2-3%, while there wasn't anything to separate Gigabyte and MSI.


Overclocking Results
Overclocking on the GTX 660 was fairly successful and followed a similar pattern to the rest of our benchmarks. ASUS was again the best performer, with core speeds raised to 1160MHz and memory to 6240MHz DDR, increasing its performance by about 4% on 3DMark 11's Performance preset, and by 6% on Extreme compared to its default settings. Compared to the reference card, this was about 11%-13% better than the its default speeds.
Efforts with Gigabyte and MSI both produced similar results, with each improving on their default scores by about 4%. Gigabyte's final core overclock was 1130MHz, with MSI's slightly higher at 1138MHz. For memory overclocking, MSI was again a bit better, as it was able to go to 6208MHz DDR compared to 6160MHz DDR for Gigabyte. As a result, MSI's overclocking performance was marginally better, outperforming Gigabyte's best OC scores by about 1%.
Interestingly, despite their limited success in overclocking, they couldn't best the overclocking capabilities of the AMD Radeon HD 7870. But that shouldn't be too much of a concern seeing the huge price difference in favor of the GeForce GTX 660 cards.

Temperature Results
While we don't have a reference score for our GTX 660, you can see that our custom cards were all scoring within the expected range for a mid-range GPU. Temperature performance followed the same pattern as our gaming benchmarks, with ASUS running the hottest due to its higher clockspeeds.
Gigabyte was the coolest performer, in contrast to the poor performance of the same cooler on the GTX 660 Ti. It seems that Gigabyte's 'open design' is better suited to lower-end cards with lower power consumption as airflow may not matter as much, and the presence of the two large 100mm fans is sufficient to keep the card cool. MSI was just one degree higher in temperature, which may be due to its slightly higher power consumption.

Power Consumption Results
As expected, ASUS had the highest power consumption, drawing about 3% more power than MSI, however this fell in line with its performance scores, where it performed on average about 3-4% better. MSI in turn drew about 2% more power than Gigabyte, which explains its higher GPU Boost score.

*Updated as of 14/09/12, 7.30pm: Ratings for the NVIDIA GeForce GTX 660 GPU SKU has been restored after re-checking results with an updated AMD Catalyst 12.8 drivers, which didn't improve the red camp's standing much at all. Hence original outcome and conclusion are still valid.
Price-Performance Comparison
When it comes to mid-range graphics cards, the key metric gamers will be looking at is the price-to-performance ratio, i.e. how much bang do you get for your buck?
For this comparison, we calculated the average FPS of each card, based on its sum total score across all settings and resolutions on our gaming benchmarks, as well as the synthetic benchmark Unigine 2.1 "Heaven". We then divided that score by the card's suggested retail price in US dollars to derive exactly what 1 US dollar will get you in terms of FPS for each card.
Model | Current Price in US$ | Average FPS | FPS per US$1 |
NVIDIA GeForce GTX 660 | $229 | 56.1 | 0.245 |
NVIDIA GeForce GTX 660 Ti | $299 | 62.1 | 0.208 |
AMD Radeon HD 7870 | $299 | 51.9 | 0.174 |
AMD Radeon HD 7950 | $349 | 57.4 | 0.164 |
NVIDIA GeForce GTX 580 | $379 | 58.3 | 0.154 |
NVIDIA GeForce GTX 560 Ti | $199 | 43.5 | 0.219 |

As you can see, the GTX 660 leads the pack, providing the most performance per dollar, with an excellent value of 0.245 FPS for every 1 US dollar. This is 17% better than what you get out of your dollar from the GTX 660 Ti, and an impressive 40% better value than AMD's Radeon HD 7870. Do remember though that this chart is not indicative of which card is more powerful, it merely shows the relative value worthiness of the card.
Additionally, these scores are in US dollars, due to it being the set SRP specified by NVIDIA and AMD. Local pricing will fluctuate based on availability and demand of each card. Do also note that AMD's recent price cuts have not yet been reflected in the local market, but we should see them trickle down within the next few months.
Conclusion
We were generally impressed with the GeForce GTX 660's performance, and it scored well enough that we can safely say it should be able to handle the needs of the average gamer. The reduction in CUDA Cores on the GK106 core has led to slightly weaker performance for games with high amounts of tessellation, and you won't be able to play 3D games or run multi-monitor setups with it, however, in all other areas, the card proved itself a strong contender.
This is the card you've been waiting for.
While we did not have AMD's direct competitor, the HD 7850 on hand, for the most part the GTX 660 was able to outgun the higher-end and more expensive Radeon HD 7870, and as such, it's safe to assume that the GTX 660 would handily outperform the Radeon HD 7850. In fact, in many of our tests, the GTX 660 even outperformed AMD's Radeon HD 7950, which is especially impressive when you consider that it's the second highest model in AMD's Graphics Core Next lineup.
Consumers who were disappointed with the pricing of the GTX 660 Ti will be pleased to see that custom factory overclocked editions of the GTX 660 generally run about S$100 less, which puts the GTX 660 right in the middle of the sweet spot for consumer pricing at between S$300-400.
For those of you trying to decide between the GTX 660 and the GTX 660 Ti, we've already seen that the GTX 660 is a better buy in terms of pure price-to-performance ratio. As for an evaluation of the actual difference in user experience, if you look purely at the numbers, the GTX 660 performed about 10-20% worse than the GTX 660 Ti. However the actual tangible difference in gaming experience is probably not worth the extra S$100. For all but one of our gaming benchmarks - the exception being the extremely taxing and high tessellation Crysis 2 - the GTX 660 was able to achieve between 30 and 60 FPS, which should be sufficient for most gamers. Do remember also that we run most of our tests at maximum settings, so turning down some options will produce better frame rates. While the GTX 660 Ti did score better, it wasn't a massive improvement, and certainly not enough to let you significantly change your in-game quality settings.
For gamers with older cards, and especially the 53% of NVIDIA users still using the old GeForce 9800 GT, the GTX 660 is a must consider. Not only will you experience a four to five times increase in performance, you'll be able to experience the upgraded visual quality of DX11, which includes better tessellation, compute shader and multi-threading support. This will be especially true for gamers planning on upgrading from Windows XP to Windows 8 this October.
Custom Card Standoff
So which card is left standing?
Our three-way shootout was very competitive, with all of our cards proving themselves as strong contenders. ASUS was the best competitor in terms of benchmark performance, maintaining a consistent lead of about 2-4% over Gigabyte and MSI. Its overclocking potential was also slightly better than its rivals. While its temperature and power consumption were also higher as a result, it was in line with its performance increase. As we've come to expect from ASUS cards, the GTX 660 DirectCU II TOP model is rather expensive at S$409, coming in at S$64 more than Gigabyte's model. While the TOP edition is only S$20 more than ASUS' reference speed DirectCU II model (retails for S$389), even that is S$44 more than Gigabyte's overclocked version.
Gigabyte's GTX 660 didn't have the big GPU Boost score of its GTX 660 Ti model, but was still competitive, scoring very close to MSI, and only just behind ASUS. Its open design Windforce cooler seemed to work better on this model, and the large fans helped it score the best temperature scores. One negative we should mention is that the cooler itself isn't the most attractive, and the 'bare bones' look probably isn't for everyone as it looks a bit like an entry-level or much older series card. Even so, its price of S$345 can't be beaten, making it significantly cheaper than both ASUS and MSI. At this price point, value is more important than squeezing out a minor increase in performance, and as such we feel that it's not worth spending the extra $64 for ASUS' model. It's possible that ASUS and MSI will adjust their pricing in future, but as with all things in tech, prices are ever-changing. If price differences were small, ASUS would have immediately gotten our nod of approval among the group.
MSI was the middle ground card in our shootout, performing slightly better than Gigabyte but without the extra heat or power consumption of ASUS. It also utilizes a slim and quite attractive cooler design that should look good in most people's cases. However, its pricing does not make it a compelling purchase, as for just a little more, you can opt for the more powerful ASUS card, or for S$44 less, you can pick up the similarly performing Gigabyte model.
| |
| |
| |
|


Our articles may contain affiliate links. If you buy through these links, we may earn a small commission.