
Q3 2007 CPU Performance Charts
It has been a year since our last CPU performance recap and with the imminent launch of a new wave of processors, there's no better time than now to roundup the performance of all desktop processors. So in this massive comparison article, we've 18 processors from the Intel and AMD with nearly 400 results put together.
A Processor Performance Recap
Exactly a year ago, www.hardwarezone.com rounded up a whole slew of dual-core performance and enthusiast class processors to give our readers a complete breakdown of how they fared. While we would have really wanted to have this comparison going every half-year, the frantic pace in hardware evolution on all fronts has caused us to re-evaluate our priorities over time.
Finally after a whole year from our last endeavor, we are back again with an updated CPU Performance Chart fitting for this time frame. With Intel's 45nm process based desktop CPU and AMD's Phenom processors set for launch in a matter of weeks, we figured that there's no better time than now to roundup all the performance figures we've painstakingly gathered over the many months of testing and set the comparison stage for the forthcoming processors. One thing to note is the upcoming new range of processors are not going to replace the bulk of the existing processors in the market anytime soon, so this roundup is certainly going to be valid for several months down the road and we are hoping this will be a reference point for many deliberators in the upgrading scene. This time around we've gathered a wide variety of Intel Core 2 and Pentium Dual-Core processors as well as AMD Athlon 64 X2 series. Before we jump to the performance graphs, we've gathered the key specs in the respective tables below to help readers better relate each processor's specs with the performance shown.
Intel Core 2 Extreme / Duo / Pentium Dual-Core Series
A year after the last recap, Intel's highly publicized Core 2 series has grown in variety to offer something for every price point and has ousted the aging Pentium D series. For the enthusiasts, Intel has had quad-core series for the entire 2007 and has in more recent times updated the core stepping to the "G0" version that is a more power optimized version with lower TDP ratings than the previous version. In the mainstream performance segment, the original Core 2 Duo series have departed and in place of the faster 1333MHz FSB variants. The Core 2 Duo E6420 and E6320 models, while still available in the market, are fast being overshadowed by the E6550 and E6750 models for superior performance at similar price points. Still, we've included their results in the graphs as they have been very popular models just like their predecessors.
The E4xxx series are lower value series parts that is based off an Allendale core rather than the full-fledged Conroe cores used in the E6xxx series. The difference being is that the Allendale has half the L2 cache size and as a result has a smaller die size. These processors also use a lower 800MHz FSB and are great for low-end motherboard chipset compatibility. For more entry level systems, Intel has the Pentium Dual-Core series that is nothing more than the same Allendale core with a L2 cache size restriction to just 1MB. Still, as we've shown in our articles, the Pentium Dual-Core processors offer unparalleled value for money when overclocked. So here's how the processors from Intel stack up:-
Processor Model / ProcessorCharacteristics | Clock Speed | L2 Cache | Front Side Bus (MHz) | Max TDP (W) | Estimated Price (US$) |
Core 2 Extreme QX6850 | 3.00GHz | 4MB x 2 | 1333 | 130 | $999 |
Core 2 Quad Q6700 | 2.67GHz | 4MB x 2 | 1066 | 95 | $530 |
Core 2 Quad Q6600 | 2.40GHz | 4MB x 2 | 1066 | 95 | $266 |
Core 2 Duo E6850 | 3.00GHz | 4MB | 1333 | 65 | $266 |
Core 2 Duo E6750 | 2.66GHz | 4MB | 1333 | 65 | $183 |
Core 2 Duo E6550 | 2.33GHz | 4MB | 1333 | 65 | $163 |
Core 2 Duo E6420 | 2.13GHz | 4MB | 1066 | 65 | $183 |
Core 2 Duo E6320 | 1.86GHz | 4MB | 1066 | 65 | $163 |
Core 2 Duo E4600 | 2.40GHz | 2MB | 800 | 65 | $155 |
Core 2 Duo E4500 | 2.20GHz | 2MB | 800 | 65 | $133 |
Core 2 Duo E4400 | 2.00GHz | 2MB | 800 | 65 | $113 |
Pentium Dual-Core E2180 | 2.00GHz | 1MB | 800 | 65 | $84 |
Pentium Dual-Core E2160 | 1.80GHz | 1MB | 800 | 65 | $74 |
Pentium Dual-Core E2140 | 1.60GHz | 1MB | 800 | 65 | $64 |
Note that some of these processors are still very new to the market and we've not been able to obtain all of them for our internal testing. As such, the following models will not be participating in our performance review:- Core 2 Duo E4600, E4500 and Pentium Dual-Core E2180. Also missing in our comparison if the E4300 model, but that's because it has been discontinued.
AMD Athlon 64 X2 Series
What about AMD? Sadly, not much has happened for most of this year other than having further processor model number revisions due to core revisions. This has unfortunately confused people at different times because there are cases where up to three different variants of the so-called same processor model exist at the same time. Some were more power efficient cores of the same core model, while other models jumped to a new core offering different technical specs, but retained the same processor model name. To add on to these, AMD has in recent times offered a "Black Edition" model that is basically means that the multiplier is unlocked and is great for overclocking efforts. The Black Editions are currently limited to the Athlon 64 X2 5000+ and the 6400+ models though.
For the most part of this year, AMD has been revising its processor prices to stay competitive with Intel, and has been trying hard to transition the 65nm Brisbane cores for its processor family. Unfortunately, the latter has been tough for AMD has they have difficulty scaling the processor frequencies. Thus even after a year since Brisbane first appeared, AMD still relies on its older 90nm Windsor cores to drive their higher performance parts. It's hard to imagine how AMD is going to deliver Barcelona and Phenom processors when they couldn't even transition to Brisbane properly. In fact, AMD has an Athlon 64 X2 5200+ model using the Brisbane core, but its availability is quite scarce for a long time. As such, most in the market are still the Windsor models.
While AMD has difficulty ramping clock speeds of the Brisbane core, they have however binned the better quality cores for 45W TDP rating and are available under the new AMD Athlon X2 BE-2xxx naming scheme. That's a good move, albeit they command a premium that gets people thinking if power savings or better performance makes better sense for their needs. With that said, here is how AMD's product mix stacks up currently:-
Processor Model / Processor Characteristics | Clock Speed | L2 Cache | Processor
Core Code | Max TDP (W) | Price |
AMD Athlon 64 X2 6400+
'Black Edition' | 3.2GHz | 1MB x 2 | Windsor | 125 | US$220 |
AMD Athlon 64 X2 6000+ | 3.0GHz | 1MB x 2 | Windsor | 125 | US$167 |
AMD Athlon 64 X2 5600+ | 2.8GHz | 1MB x 2 | Windsor | 89 | US$146 |
AMD Athlon 64 X2 5200+ | 2.6GHz | 1MB x 2 | Windsor | 89 | US$125 |
AMD Athlon 64 X2 5000+ | 2.6GHz | 512KB x 2 | Brisbane | 65 | US$115 |
AMD Athlon 64 X2 4800+ | 2.5GHz | 512KB x 2 | Brisbane | 65 | US$104 |
AMD Athlon 64 X2 4400+ | 2.3GHz | 512KB x 2 | Brisbane | 65 | US$89 |
AMD Athlon 64 X2 4200+ | 2.2GHz | 512KB x 2 | Windsor | 65 | US$78 |
AMD Athlon 64 X2 4000+ | 2.1GHz | 512KB x 2 | Brisbane | 65 | US$68 |
AMD Athlon X2 BE-2400 | 2.3GHz | 512KB x 2 | Brisbane | 45 | US$104 |
AMD Athlon X2 BE-2350 | 2.1GHz | 512KB x 2 | Brisbane | 45 | US$96 |
AMD Athlon X2 BE-2300 | 1.9GHz | 512KB x 2 | Brisbane | 45 | US$91 |
As always, we would love to test as many processors as possible, but as much as we've tried requested from AMD, they were unable to obtain some of the Brisbane processors for our testing needs. As such these processor models are unavailable in our comparison matrix: Athlon 64 X2 4800+, 4400+, 4000+ and the BE-2400 processors. The latter is just too new that it's hard to come by, just like the high-end 6400+ model that is also not in the comparison.
Test Setup & Benchmarks
With the recap of dual-core processors, variety and updates to the series since we've last discussed about them, we're all set to lay down the test setup specs used to benchmark them. The outcome of which, we have obtained roughly 400 results that we've compiled from running 18 different processors across our suite of benchmarks. Here then are the testbed specifications used for this review:-
Intel Core 2 and Pentium Dual-Core Configuration
- Intel Desktop Board D975XBX (Intel 975X Express chipset)
- Intel Core 2 Extreme QX6850, Core 2 Quad Q6700, Q6600, Core 2 Duo E6850, E6750, E6550, E6420, E6320, E4400, Pentium Dual-Core E2160 and E2140.
- 2 x 512MB Corsair XMS DDR2-800 non-ECC memory modules (CAS 4. 4-4-12)
- Seagate Barracuda 7200.7 80GB SATA hard disk drive (one single NTFS partition)
- MSI GeForce 7900 GT 256MB - with NVIDIA Detonator XP 84.21
- Microsoft Windows XP Professional with Service Pack 2
AMD Athlon 64 FX / X2 Configuration
- ASUS M2N32-SLI Deluxe (nForce 590 SLI chipset)
- AMD Athlon 64 X2 6000+, 5600+, 5200+, 5000+, 4200+, BE-2350 and BE-2300.
- 2 x 512MB Corsair XMS DDR2-800 non-ECC memory modules (CAS 4, 4-4-12)
- Seagate Barracuda 7200.7 80GB SATA hard disk drive (one single NTFS partition)
- MSI GeForce 7900 GT 256MB - with NVIDIA Detonator XP 84.21
- Microsoft Windows XP Professional with Service Pack 2
The benchmarks used in this review include:-
- SPECCPU 2000 v1.3
- Futuremark PCMark 2005 Pro
- BAPCo SYSmark 2004
- Lightwave 3D 7.5
- Cinebench 2003
- XMpeg 5.03 (DivX 6.2.5 encoding)
- Futuremark 3DMark06 Pro
- Unreal Tournament 2004
- AquaMark3
- Quake 4 ver.1.20
Results - SPEC CPU2000 v1.3 (Speed tests)
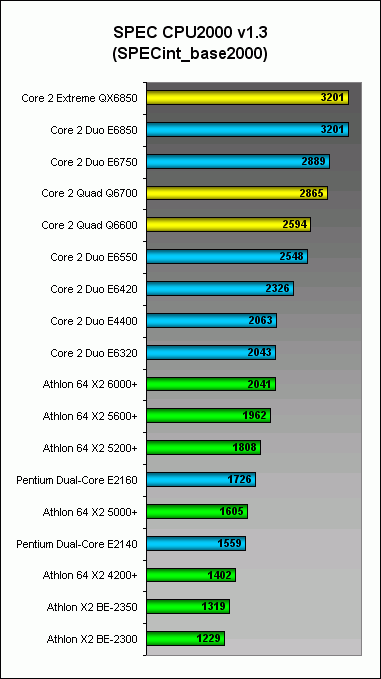
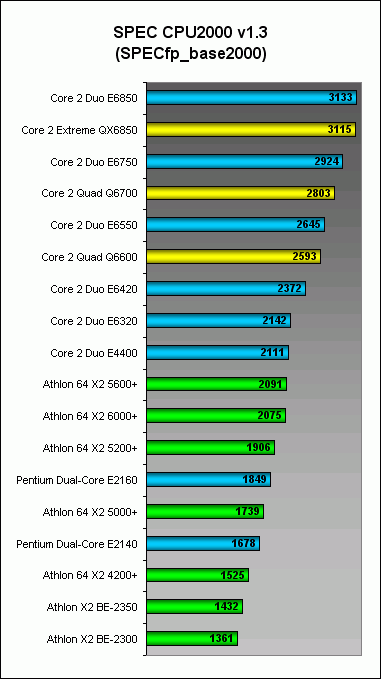
First up for comparison, we have the industry leading benchmark from Standard Performance Evaluation Corporation's (SPEC) CPU2000 version 1.3. Consisting of two time consuming benchmark suites for measuring compute-intensive integer performance and floating-point performance, the organization's efforts to standardize comparison among several classes of computers have gained them wide accreditation and is an often used measurement of performance in the industry. When properly configured for the complete batch run, completion times aren't measured in minutes nor hours, but in days; that's how compute intensive it is even for the top of the line consumer and workstation systems. You would need a server farm if you ever wanted to reduce that timeline drastically, which even then is considered long for an average enthusiast benchmark.
The results on this page reflect scores from their integer and floating-point test suites and help us rank how capable each processor is in either type of workload. Thus, the higher the scores, the better. Generally, the results are influenced by the CPU architecture and frequency if all other system variables are constant as this is test suite uses a single-core only Expectedly, most of the Core 2 series fare better than the AMD's offerings, even if you were to scrutinize them at equivalent price points for both integer and floating-point workloads.
Results - SPEC CPU2000 v1.3 (Rate tests)
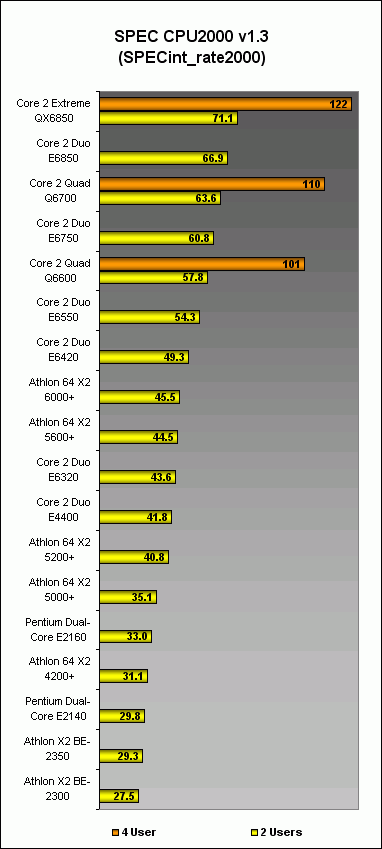
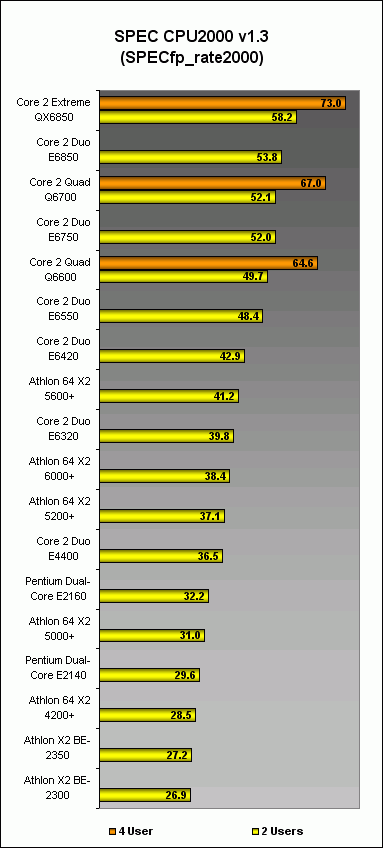
Still on SPEC CPU2000, we now compare the processor's throughput capability by running multiple copies of the workload to completely populate both cores in each processor. Since many programs these days are dual-core optimized, we've chosen to shown to show two-copy results for the main comparison whilst quad-core processors had four-copy results in the mix as well. The results give you a glimpse of how useful the four cores can be with the right workloads utilizing the processor's full resources. Overall, the standings in this test are similar to the earlier speed-tests on the previous page.
Results - Futuremark PCMark05
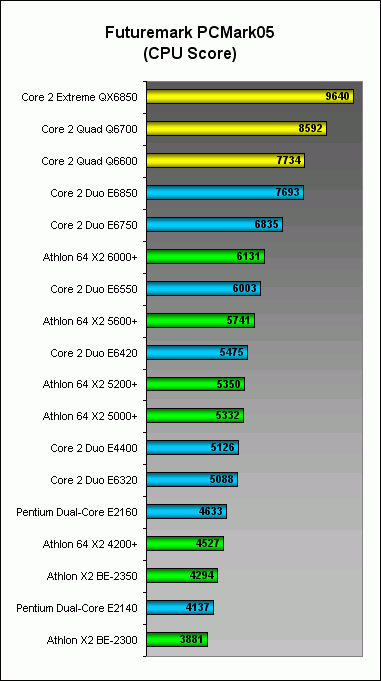
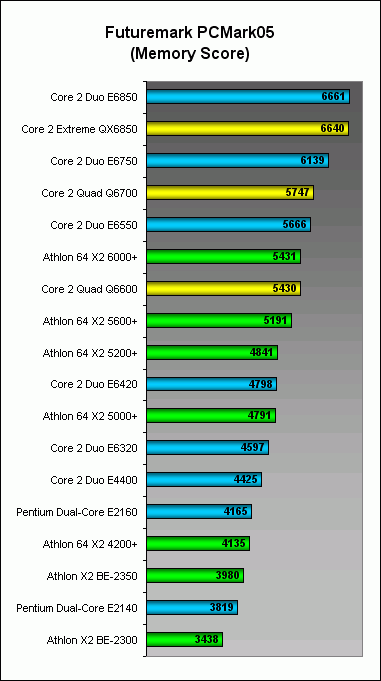
Next, we have some lighter set synthetic tests. Futuremark's PCMark05 contains several small synthetic subsystem tests that generally pinpoint the system's capabilities in brief. They are not exactly representative of the real world, which is why they are known as synthetic tests. However, these are useful references for benchmark enthusiasts who would like to gauge how their system fares.
Results - SYSmark 2004
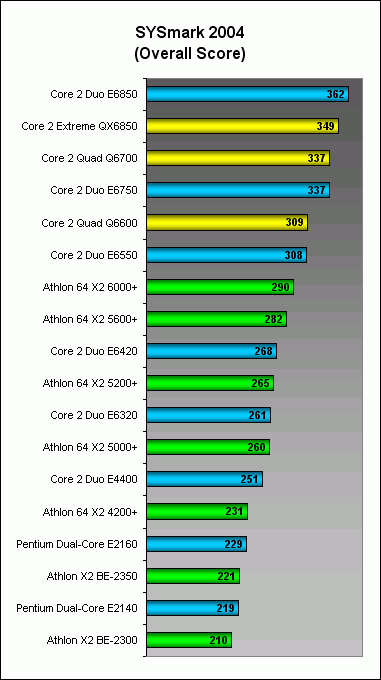
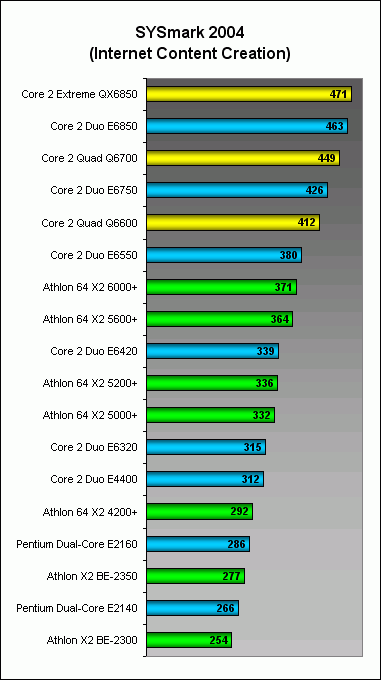
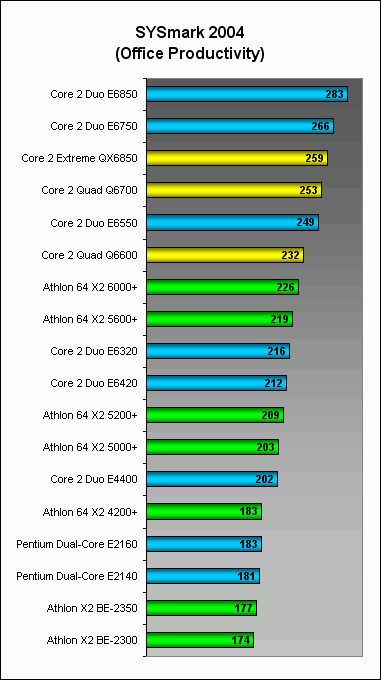
Bapco's SYSmark 2004 is an indispensable benchmarking tool in our test labs for its ability to portray heavy system usage using true applications in multi-tasking mode. That's tough to replicate, but that's exactly this benchmark's forte. Workloads are split up in two categories - Internet Content Creation and Office Productivity. The overall rating is a combination of the scores from both groups in a predefined formula. AMD fared competitively in this benchmark generally, but moving towards the high-end spectrum, Intel's processors were better in price-performance. Note that the quad-core processors hadn't made much of an impact here and were actually hampered in the Office Productivity suite, clearly spelling that the benchmarks there weren't multi-core friendly. As soon as we get SYSmark 2007 Preview working without unexpected drop-outs, we can commence transitioning to this benchmark with more updated applications, but at the moment, we're still in the trial phases.
Results - Lightwave 3D 7.5
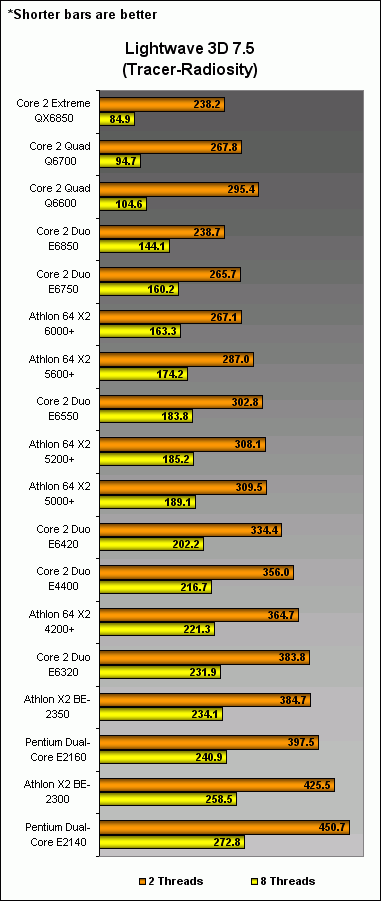
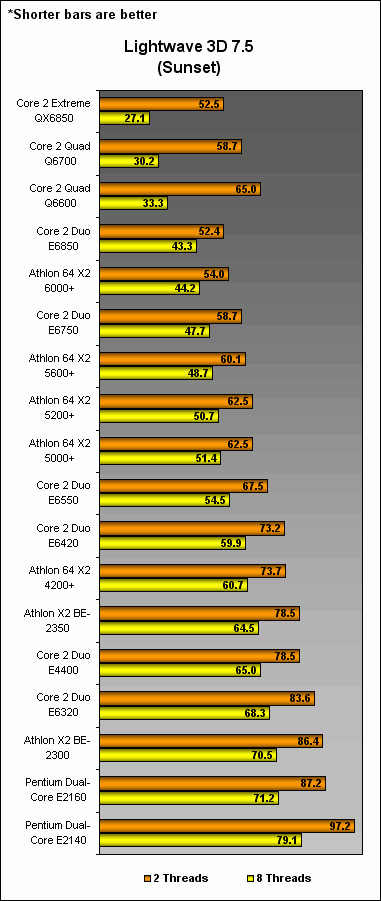
In this popular rendering benchmark, AMD picked up the pace and was in a number of situations more price competitive for the performance offered. While quad-core Intel processors didn't fare too well on dual-thread workloads possibly due to scheduling threads to the incorrect cores at times, they did boast their true nature at the maximum eight-thread workloads where other processors would have been saturated.
Results - Cinebench 2003
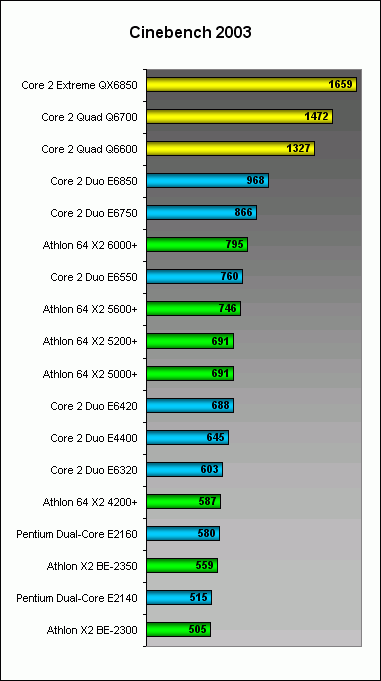
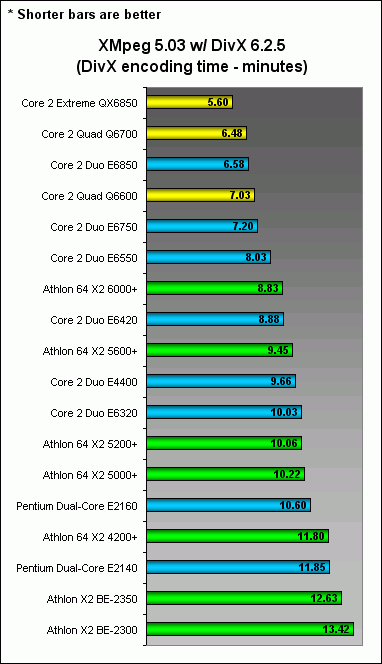
Another popular render based benchmark that's highly threaded, the performance standings are quite similar to what we've seen in Lightwave benchmarking, where AMD and Intel processors fared equally well for their price-performance categories.
Results - Futuremark 3DMark06
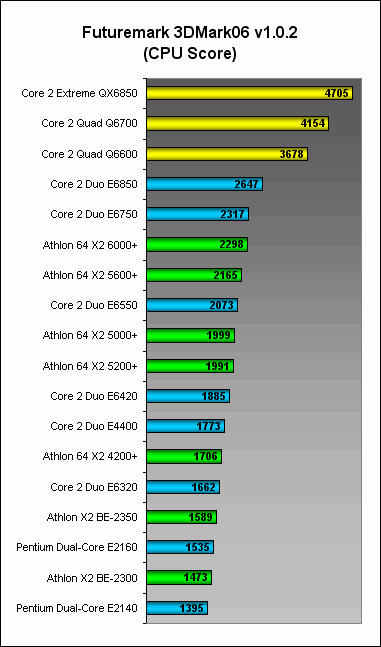
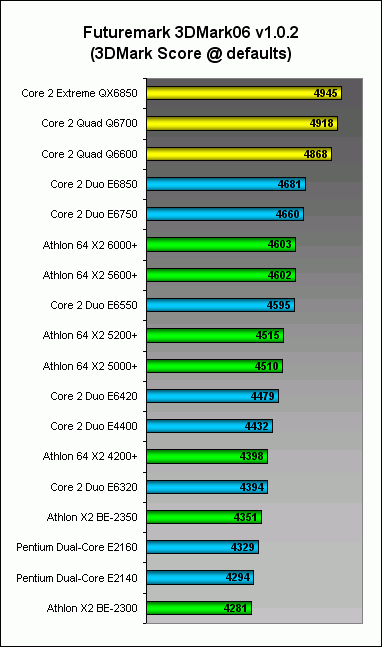
In our synthetic game tests, CPU-based rendering scores were well in favor of high-end Core 2 processors since 3DMark06 game and CPU-test engines are highly threaded and can take advantage of the quad-core processors. Focusing on dual-core processors only, again AMD has a pretty decent performance standing along with Intel processors. However, if you take into considering the overclocking potential, Intel processors would be triumphing in all benchmarks. It is well known that AMD processors do not have the same kind of headroom that Intel processors have.
Results - Unreal Tournament 2004
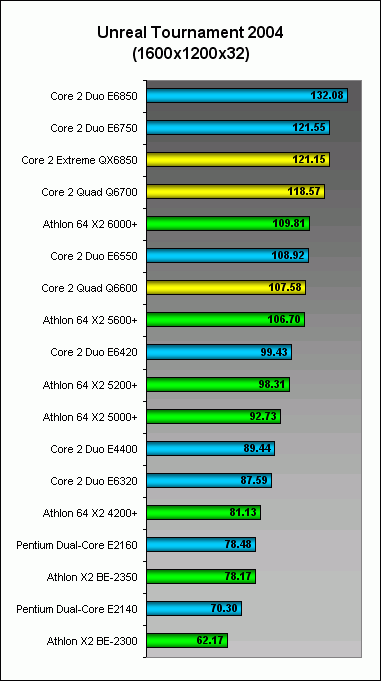
On an older game engine like Unreal Tournament 2004 where the graphics subsystem isn't taxed as much and the CPU does a fair share of workload as well, you can notice much larger gains from progressing through the various processors. Too bad it's not multi-core friendly as the results show, but this kind of performance is expected in many of the existing games where multi-core processors generally show little or no gain depending on how the game issues instructions and how the processor tackles them. Generally, all the processors fare reasonably in their own turf. In the future, we'll be transitioning to Unreal Tournament 3 for a more up-to-date comparison. So this is likely the last major roundup on this older game benchmark.
Results - Quake 4
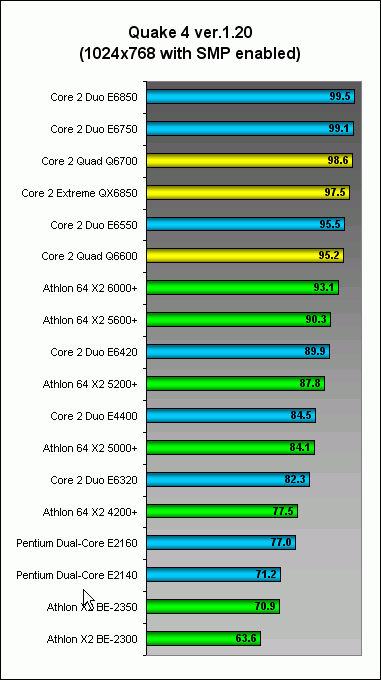
In Quake 4, all the processors are competitively placed but the low-end segment is skewed towards Intel processors. Despite the game engine having native SMP support, it doesn't take well to quad-core processors.
Results - AquaMark 3
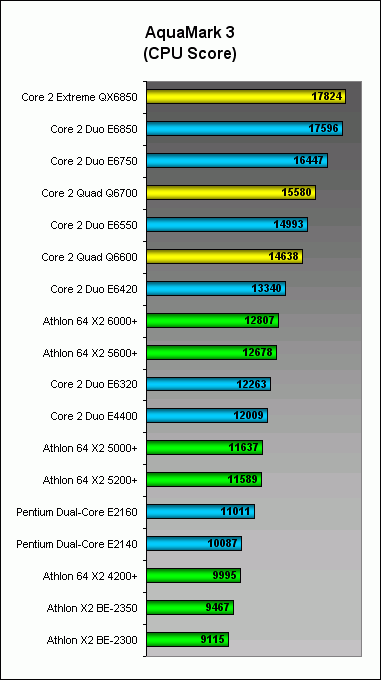
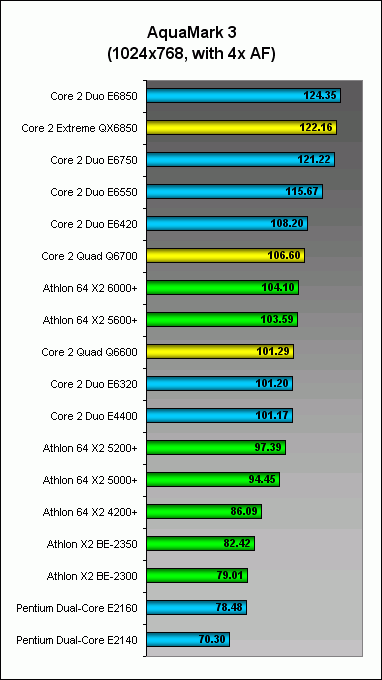
AquaMark 3 is another benchmark belonging to the older game engine class, but in this benchmark, the Core 2 series are more favorable than the AMD processors. On the low-end segment, Intel's Pentium Dual-Core series fare better in the CPU scores, but falter in the game's actual frames per second output. However it is this very series that has become the hot favorite of overclockers around the world as it can be pushed to speeds in excess of the top performing processor with relative ease. It's no wonder the Pentium Dual-Core series bagged our Most Value For Money Award.
Aggregate Performance
Over the last 10 pages, we've covered close to 400 results from 18 processors across nearly a dozen benchmarks. Similar to last year, Intel has the performance crown largely in due part to it advanced manufacturing process that enables is to deliver quad-core processors while AMD doesn't and won't have any till later this year. The mainstream performance group however, is quite a mixed bag of results where both Intel and AMD processors seem to have all performance points covered and it's quite difficult to paint the clear picture from across all benchmarks. For this purposed, we've simplified the comparison by aggregating the benchmark results to form a composite index for all processors tested. This is only a general comparison and will hold true only if one doesn't have any strong priorities to sway his or decision based on a particular usage model. Of course different people will always have different needs, thus the general comparison would be the most effective for an overview article such as this.
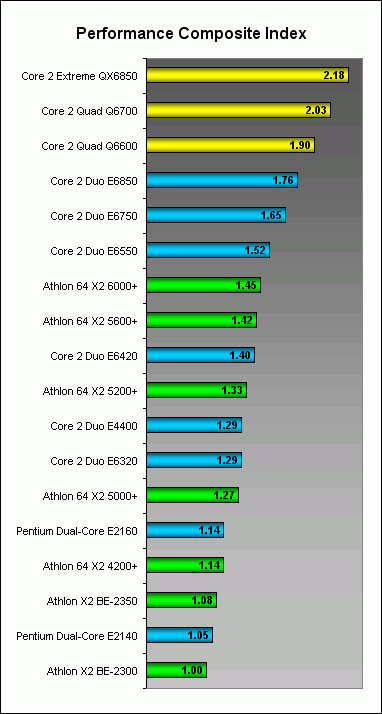
We used only one set of results from each of the benchmarks to avoid overweighing any one benchmark. This means if we had multiple benchmark configuration results to show earlier, we chose only the most appropriate configuration that best represents the benchmark's competence. The exception here is SPEC CPU2000 where the results were split up for integer and floating-point loads, thus we used results (two-user rate for dual-core processors and four-user rate for quad-core processors) from both sets to show a more balanced outlook. Finally, we compared the performance of all the processors against the AMD Athlon X2 BE-2300 (which held up the rear of most benchmarks) and aggregated the difference (mostly performance gain) with respect to this processor. Although we would love to tabulate all the differences in a table, there are just too many benchmarks and processor comparisons to properly fit within a page to be of meaningful value. Thus, we have axed that and shown you the final composite performance index graph directly.
So in the composite performance index below, the Athlon X2 BE-2300 is our baseline comparison with a score of 1.00. Thus the score of 1.76 for the Core 2 Duo E6850 for example, represents that it is on average 76% faster than the Athlon X2 BE-2300 processor. We would like to stress again that actual workload differences would result in varying performance gains, but the below is a rough aggregation based on our benchmarks and test scenarios. From the charted index, AMD's processors are contesting in the mid and low-end segment, while Intel's high-end dual-core processors and the quad-core processors top the chart. While this performance composite index leads the way to understanding where the processors rank generally, there's still some decision making needed with regards to price points. For example, the Pentium Dual-Core E2160 is tied with the Athlon 64 X2 4200+, but which is more worthy? We'll find that out on the next page.
Price Performance Index & Closing Comments
On this page, we find out which processor gives you the best price performance balance. For this purpose, we've used AMD's and Intel's published processor prices which are generally quite close to the prices offered by online retailers. We then used the composite performance index scores to derive the price performance index (which is then multiplied by 100 to give a reasonable figure) as illustrated in the table below. Higher values indicate more performance per dollar spent. Take note that the table has been arranged with reference to the highest composite performance index to the lowest:-
Processor Model | Composite Performance Index | Estimated Price (US$) | Price Performance Index |
Core 2 Extreme QX6850 | 2.18 | 999 | 0.218 |
Core 2 Quad Q6700 | 2.03 | 530 | 0.383 |
Core 2 Quad Q6600 | 1.90 | 266 | 0.714 |
Core 2 Duo E6850 | 1.76 | 266 | 0.662 |
Core 2 Duo E6750 | 1.65 | 183 | 0.904 |
Core 2 Duo E6550 | 1.52 | 163 | 0.936 |
Athlon 64 X2 6000+ | 1.45 | 167 | 0.868 |
Athlon 64 X2 5600+ | 1.42 | 146 | 0.971 |
Core 2 Duo E6420 | 1.40 | 183 | 0.766 |
Athlon 64 X2 5200+ | 1.33 | 125 | 1.066 |
Core 2 Duo E4400 | 1.29 | 113 | 1.142 |
Core 2 Duo E6320 | 1.29 | 163 | 0.791 |
Athlon 64 X2 5000+ | 1.27 | 115 | 1.105 |
Pentium Dual-Core E2160 | 1.14 | 74 | 1.546 |
Athlon 64 X2 4200+ | 1.14 | 78 | 1.460 |
Athlon X2 BE-2350 | 1.08 | 96 | 1.129 |
Pentium Dual-Core E2140 | 1.05 | 64 | 1.636 |
Athlon X2 BE-2300 | 1.00 | 91 | 1.099 |
To visibly see which processor offers better value and at the same time maximizing performance, we decided to color code the price performance index in three distinct price categories (below US$100, US$100 - 200 and above US$200) and plotted it against our previous graph which is the raw composite performance index (that's matched against the Athlon X2 BE-2300 baseline):-
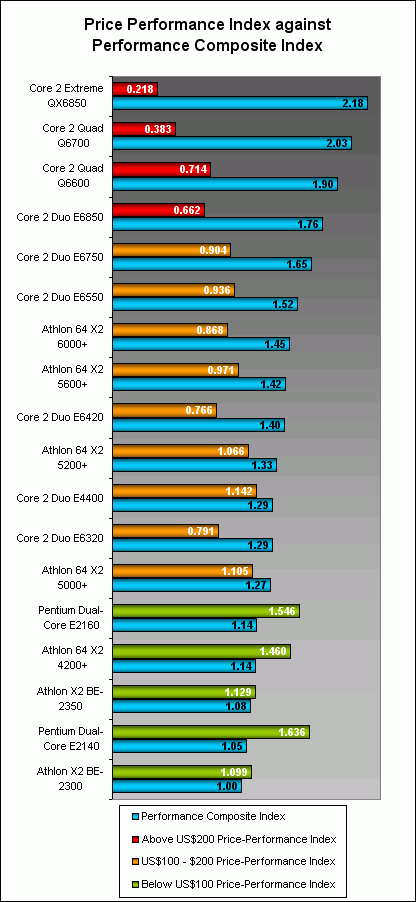
As the legend dictates, red indicates price performance index of processors over US$200, while orange is reserved for processors of the US$100 to US$200 category and green for the most affordable class below US$100. Generally the sweet spot would be a processor whose price performance index and the composite performance index within the category are both high. On an overall note, price and performance were much better matched from AMD and Intel this year as opposed to last year.
Starting off with the sub US$100 green segment, the Pentium Dual-Core E2140 offers the highest price performance index, but is expectedly among the lowest performers in the group. Good thing that it however manages to stay ahead of the AMD Athlon X2 BE-2300 on all grounds except power consumption. And as shown in our article dedicated to that processor, it's not much of a power saver over the Intel counterpart. Plus factor in the vast overclocking potential of the Pentium Dual-Core processors, you certainly can't go wrong with them. We highly recommend this Intel series in the budget group of processors be it for normal use or for overclocking. The same goes for the identical performing Athlon 64 X2 4200+ and the Pentium Dual-Core E2160 as the latter has the edge in price.
In the mid performance group whose price ranges between the US$100 and the US$200 category, the Core 2 Duo E4400 and the Athlon 64 X2 5000+ both offer great price performance indices. If you want more performance, the Core 2 Duo E6550, E6750 and the Athlon 64 X2 5600+ all offer compelling price points worthy of consideration. The Intel Core 2 Duo E6420 and E6320 processors are not recommended for their price points as E6550 and E6750 supersedes their performance at the same price. Clearly, they are on their way out of the market, but it will be sometime before those stocks deplete. So beware of them unless there's a great bargain on them.
Over in the high-end processor group of above US$200, it seems that the Core 2 Quad Q6600 offers the best bang for the buck, but beware of the application mix you throw at it. Those that do benefit from the quad processing cores, your money is well spent on this CPU. However, if you feel that most of what you're running is single-threaded or lightly-threaded, you're better off with the fastest Core 2 Duo, the E6850 processor. It's difficult to say how much software will mature in the next year as it has taken some time for dual-cores to show their advantage and it will be more time yet before quad-cores reciprocate in the same manner. Game developers say that the upcoming games around the year-end and early next year would have much better support for quad-core processors, but we really can't vouch anything till the actual goods arrive. For the moment, if you belong to the group of heavy multi-taskers who transcode videos often while gaming or performing other system maintenance tasks like running anti-virus and the likes, quad-core offers you a much smoother experience and room to cram even more tasks in parallel.
However we remind you once again that our recommendations are quite generalized after much averaging of the workloads and results to obtain a single measure of comparison for each processor. This is useful if you are not sure what to choose, but if you have specific usage model(s), we urge you to compare the individual performance results for a more targeted outlook suiting your needs. Another catch to the price performance index is that this only takes into account of the processor's price and not of the platform. Intel's platforms tend to be a little pricier as opposed to those supporting AMD processors and a perfect example is the Intel P35 Express class motherboard. There are numerous variables on the motherboard aspect and the choices made are very much based on user preferences. Thus, this cannot be accurately accounted for in our article. Overall, this is our attempt at making sense of price and performance. It does not intend to be a tell-all definitive chart as other factors like heat dissipation and power consumption were not considered, thus, these factors can tip the balance of the charts as well. The term performance in this chart basically means 'raw' performance and nothing more.
With that note, this brings us to the end of the article and we hope it has helped you as an important point of reference to make more informed purchase decisions on your next processor upgrade and even serve as a base of comparison against the upcoming processors. The new class of processors from Intel and AMD are just around the corner but we expect most would be high-end processors, which shouldn't affect much of the processors compared in this article. Remember this time last year, we were comparing processors of much higher value than today and thanks to the heated competition between AMD and Intel, the bulk of the processors are well below the US$200 mark. This might change with the new influx of processors, but that's another topic waiting to be unraveled when the time is right. So for now hold that thought as the year is almost drawing to an end, and with that more exciting hardware awaits us all with www.hardwarezone.com in the thick of the action covering the scoop.
Our articles may contain affiliate links. If you buy through these links, we may earn a small commission.