AMD Ryzen 3 vs. Ryzen 5 vs. Ryzen 7 2000-series: Which processor is right for you?
Which AMD 2nd generation Ryzen processor should you pick for your next system? We run through a whole slew of them to find out! Compared within:- Ryzen 7 2700X, Ryzen 7 2700, Ryzen 5 2600X, Ryzen 5 2600, Ryzen 5 2400G and Ryzen 3 2200G.
Note: This article was first published on 22nd August 2018.
Spoilt for choice

AMD Ryzen 7 2700X. (Image Source: AMD)
AMD has had an eventful 2018. Hot on the heels of the launch of its second-generation Ryzen processors and Ryzen APUs with Vega graphics, the chipmaker launched its refreshed Threadripper line-up, helmed by the 32-core Threadripper 2990WX.
The company now has something for pretty much any segment of the market, regardless of whether you’re looking to build a low-cost productivity machine, game, or work with character modeling.
That said, the new Ryzen chips and Raven Ridge APUs comprise a total of six processors, and that’s what we’re going to be focusing on today. While it’s pretty obvious who Threadripper is for, namely, hardcore gamers and serious enthusiasts, the mainstream Ryzen chips cater to a much broader swath of consumers who may have a harder time settling on the right chip.
For starters, the biggest divide sits between the Pinnacle Ridge Ryzen processors and Raven Ridge APUs. In the following paragraphs, we’ll talk about the differences between the two, their respective chip designs, and key new features before moving on to the performance numbers.
Zen meets Vega
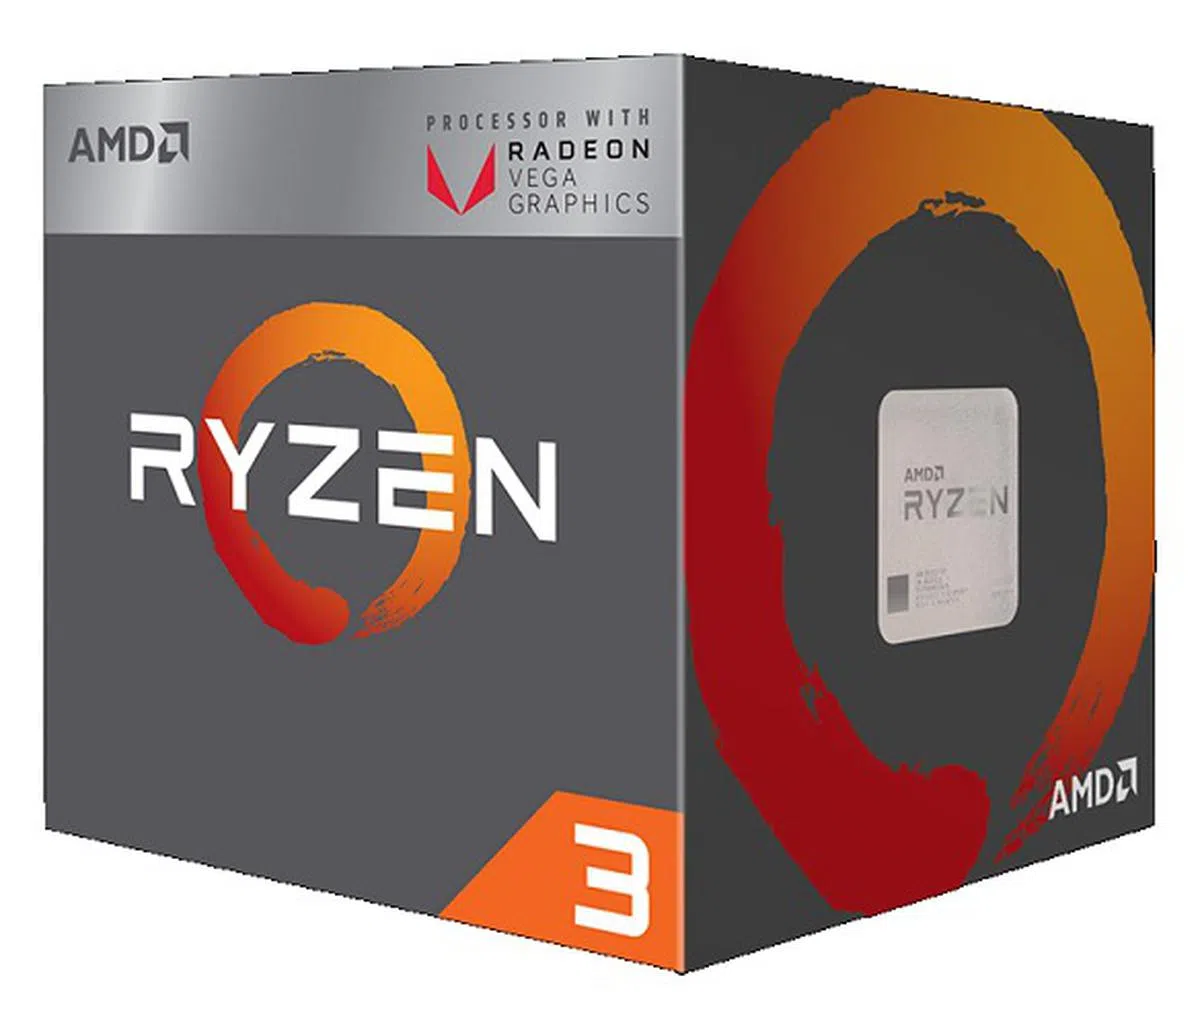
AMD has made available two Raven Ridge APUs, the S$145 Ryzen 3 2200G (3.5GHz, 4MB L3 cache) and S$237 Ryzen 5 2400G (3.6GHz, 4MB L3 cache). Both of these are quad-core chips, but the Ryzen 5 2400G supports simultaneous multi-threading for a total of 8 threads.
Compared to the Ryzen 3 1200 (3.1GHz, 8MB L3 cache) and Ryzen 5 1400 (3.2GHz, 8MB L3 cache), the Raven Ridge chips sport higher base and boost clocks, which will help in applications that are sensitive to clock speeds, such as games.
Here's an overview of their specifications:
Cores/Threads | Base/Boost Frequency | Graphics Model | Graphics Core Count | Max. GPU Clock | L2/L3 cache | TDP | Price (SGD) | |
Ryzen5 2400G | 4/8 | 3.6GHz/3.9GHz | Radeon Vega 11 Processor Graphics | 11 | 1,250MHz | 6MB | 65W | $234 |
Ryzen 3 2200G | 4/4 | 3.5GHz/3.7GHz | Radeon Vega 8Processor Graphics | 8 | 1,100MHz | 6MB | 65W | $144 |
We've already covered the basics in this article looking at their graphics performance, but here's a recap anyway.
The basic building block of the Zen microarchitecture is a quad-core CPU complex (CCX), where each CCX houses 8MB of L3 cache. This comes together with another quad-core CCX to form an 8-core Zeppelin die.
The Raven Ridge APUs use the same underlying approach, but with key differences. Instead of a 2+2 design where two cores are symmetrically disabled across two CCXs, both chips use a single CCX configuration and a 4+0 design.
In addition, there's less L3 per core – 1MB instead of 2MB – so you get a total of 4MB of L3 cache instead of 8MB.

Ryzen APU topology. (Image Source: AMD)
One benefit of having all four active cores in the same CCX is the possibility of reduced latency because any application that uses multiple cores will not have to use the Infinity Fabric interconnect to talk to cores and cache on another CCX.
The Vega graphics engine sits where the second CCX would have been, effectively combining Zen cores with Vega graphics on the same piece of silicon.
The Zen core complex and Vega graphics are linked together via AMD's Infinity Fabric, which in turn also services clients like the multimedia engines, display engine, DDR4 memory controllers, and the I/O and system hub.
Finally, the Raven Ridge chips are based on a 14nm+ FinFET process that is a density-optimized version of the 14nm node it was using before. This is different from the 12nm LP process that AMD's Pinnacle Ridge chips are using.
Zen+ is a new and better Zen
GlobalFoundries' 12nm LP process offers the second-generation Ryzen processors 10 to 15 per cent better transistor performance than preceding nodes, which extends the clock speed range of the processors and reduces the required current at all frequencies.
That's reflected in the higher base and boost clocks, which you can see below:
Cores/Threads | Base/Boost clock | L3 cache | TDP | Cooler | Price (SGD) | |
Ryzen7 2700X | 8/16 | 3.7GHz/4.3GHz | 16MB | 105W | Wraith Prism (LED) | $485 |
Ryzen7 2700 | 8/16 | 3.2GHz/4.1GHz | 16MB | 65W | Wraith Spire (LED) | $448 |
Ryzen 5 2600X | 6/12 | 3.6GHz/4.2GHz | 16MB | 95W | Wraith Spire | $335 |
Ryzen5 2600 | 6/12 | 3.4GHz/3.9GHz | 16MB | 65W | Wraith Stealth | $292 |
One of the key weaknesses of the first generation of Ryzen processors was its relatively weak performance in games at 1080p, so the higher overall clock speeds should do something to alleviate that.
In addition, AMD is claiming a 50mV reduction in core voltage across the entire operating range of the chips.
Zen+ also features design optimizations to speed up access to cache and memory, which can help boost performance in latency-sensitive tasks. According to AMD, you can expect the following improvements:
- 13% reduction in L1 cache latency
- 34% reduction in L2 cache latency
- 16% reduction in L3 cache latency
- 11% reduction in DRAM latency
The new processors also officially support DDR4-2933 memory now, up from DDR4-2667 from before.
What new features are there?
Both the Pinnacle Ridge and Raven Ridge processors employ Precision Boost 2, an improved version of the Precision Boost frequency boosting algorithm that AMD used on its Ryzen 1000-series desktop processors.
Precision Boost distinguished between dual-core and all-core boost frequencies. This means that in cases where a certain workload utilized multiple threads but did not utilize each core fully, the frequency would still drop to the lower all-core frequency, even though there was technically no thermal or other utilization limitations that preventing the frequencies from boosting higher.
It's not difficult to see why this wouldn't be the most effective implementation for the best possible performance, and AMD's looking to address this issue with Precision Boost 2.

Precision Boost 2 does away with the strict distinction between dual-core and all-core workloads. (Image Source: AMD)
Precision Boost 2 does away with this dualistic model and replaces it with a new and more opportunistic algorithm. It utilizes Dynamic Voltage Frequency Scaling (DVFS) technology, and relies on data on CPU temperature, current, and load.
Instead of a steep drop-off when moving from an a dual-core boost to an all-core boost, Precision Boost 2 seeks to enforce a smoother curve, while at the same time seeking to implement the highest possible frequency (while sticking to built-in thermal, electrical, and frequency limits).

You can see here the difference between the two-step boost model of the original Precision Boost and the more graceful curve of Precision Boost 2. (Image Source: AMD)
It retains the same 25MHz granularity as the original Precision Boost, but it allows select cores to boost higher in certain scenarios such as games. In other words, you should enjoy a performance boost because the processor is freed up to run at higher clock speeds than before.
This process is a continuous adjustment loop, relying on information gathered by AMD's SenseMI Technology about things like voltage, current, and temperature.
Then there's a new version of AMD's Extended Frequency Range (XFR) technology dubbed XFR2. AMD allows the processor to maintain higher frequencies for longer if users have a high-end cooling solution installed that exceeds the recommended thermal specifications, but this was restricted to just a small number of cores on the Ryzen 1000-series chips.
In comparison, XFR2 now operates across all cores and threads, just like Precision Boost 2. This should result in an overall higher average clock speed, and give users a modest uplift in performance.
Test setup
The configurations of the test setups we used are listed below. Do note the differences in motherboards and coolers between the Pinnacle Ridge and Raven Ridge processors.
Pinnacle Ridge
- Thermaltake Water 3.0 360 Riing RGB Edition
- ASUS ROG Crosshair VII Hero
- 2 x 8GB G.Skill Sniper X DDR4-3400 (Auto timings: CAS 14-14-14-34)
- ASUS ROG Strix GeForce GTX 1080 Ti Gaming
- Samsung 860 EVO M.2 SATA SSD
- Windows 10 Home (64-bit)
Raven Ridge
- AMD Wraith Prism
- Gigabyte AB350N Gaming WIFI
- 2 x 8GB G.Skill Sniper X DDR4-3400 (Auto timings: CAS 14-14-14-34)
- Samsung 850 Pro SATA SSD
- Windows 10 Home (64-bit)
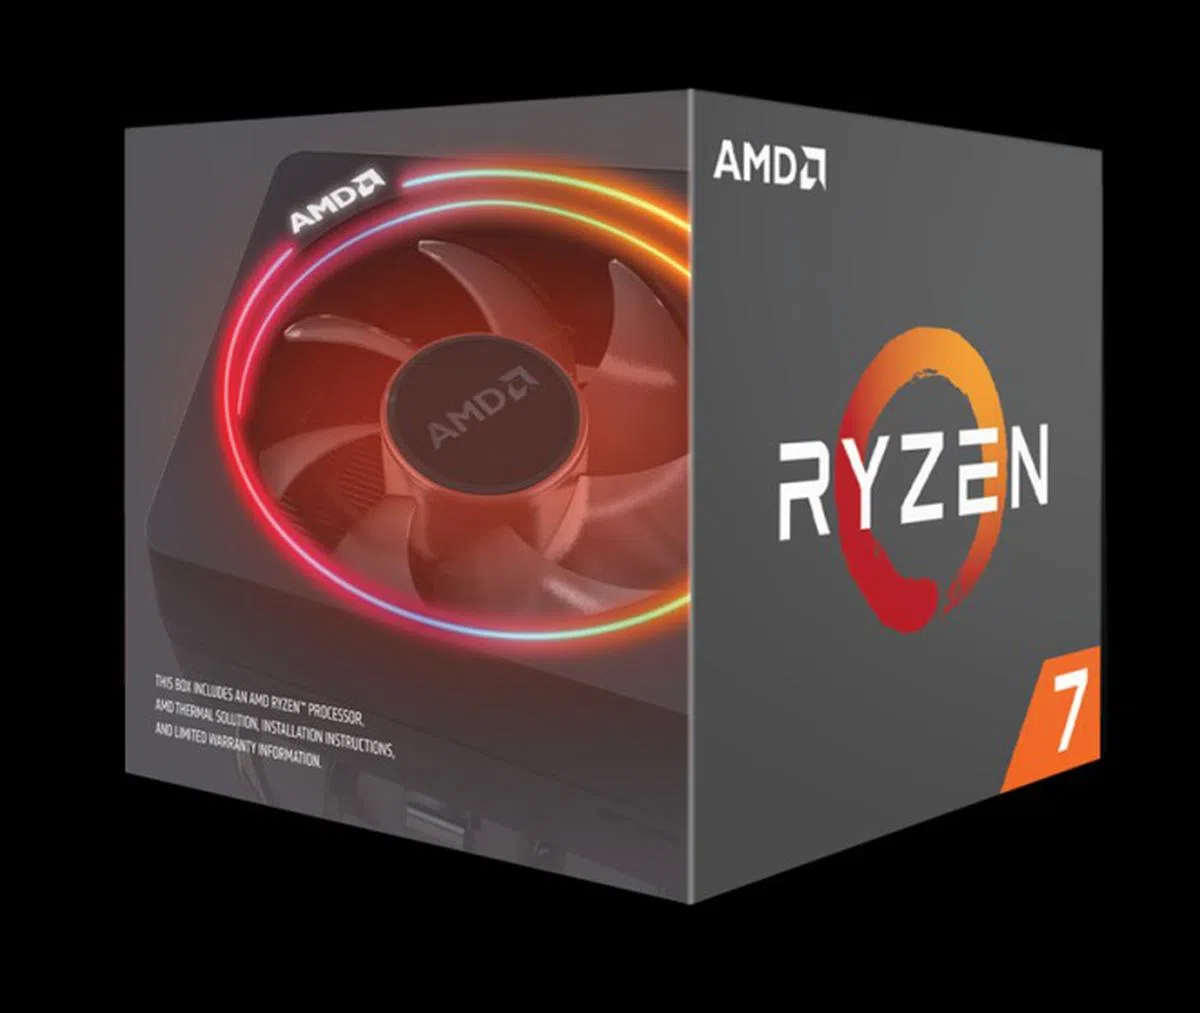
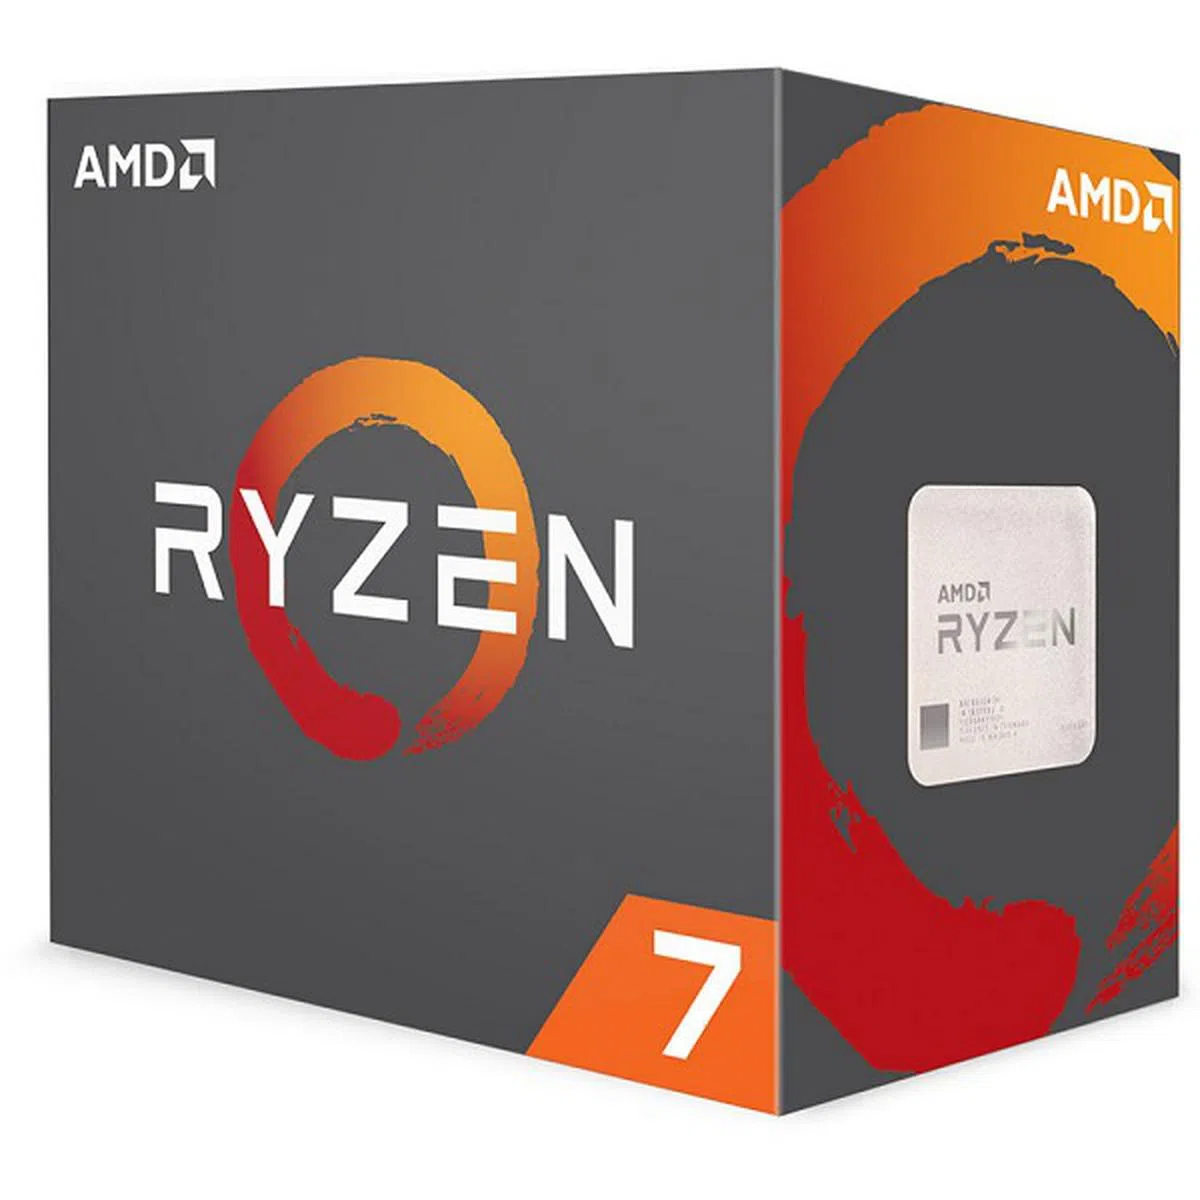
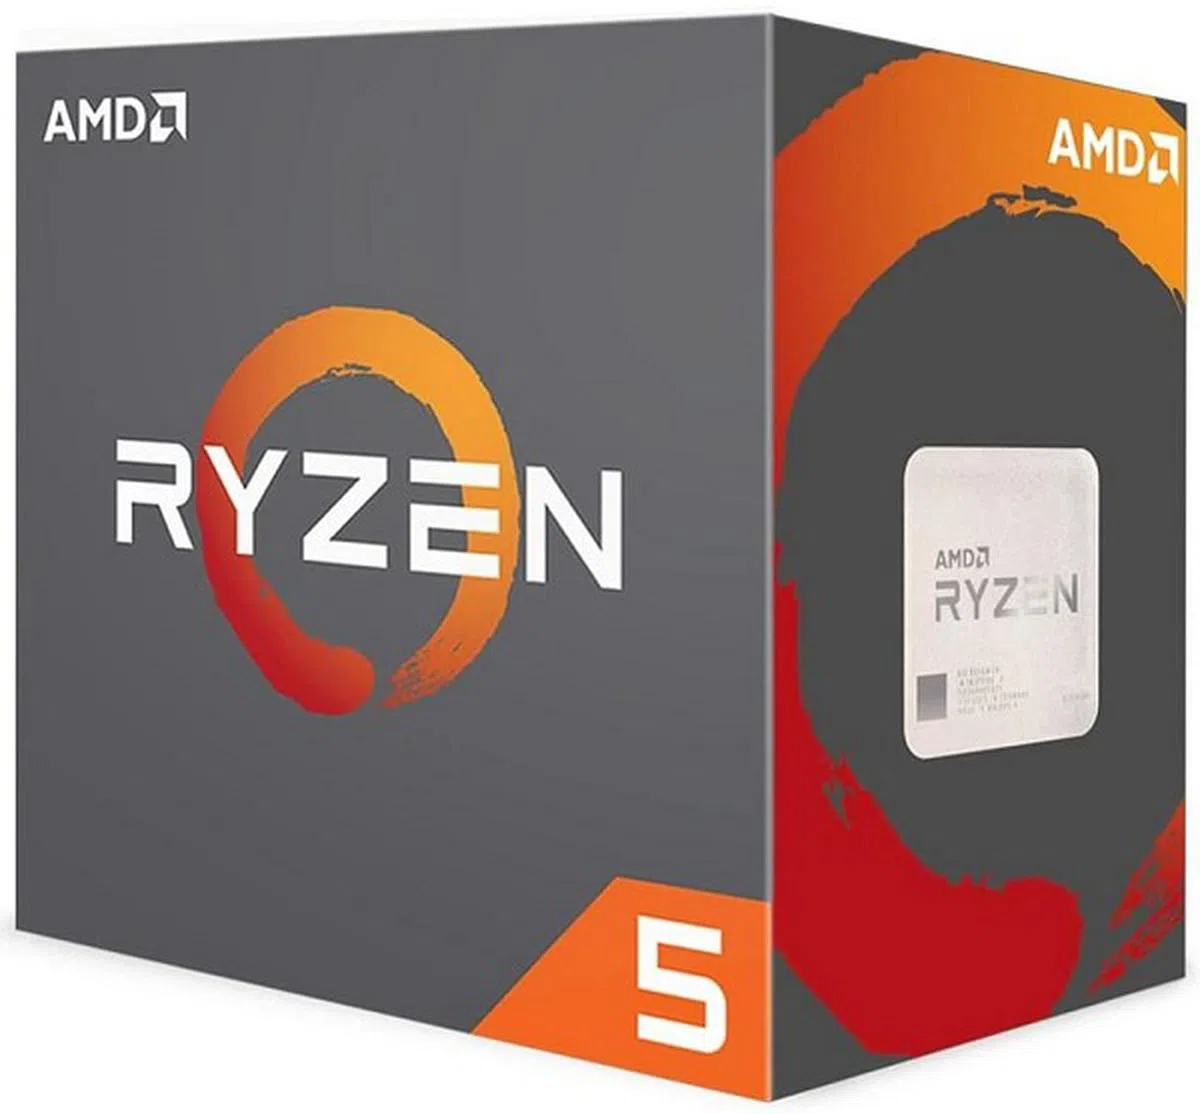
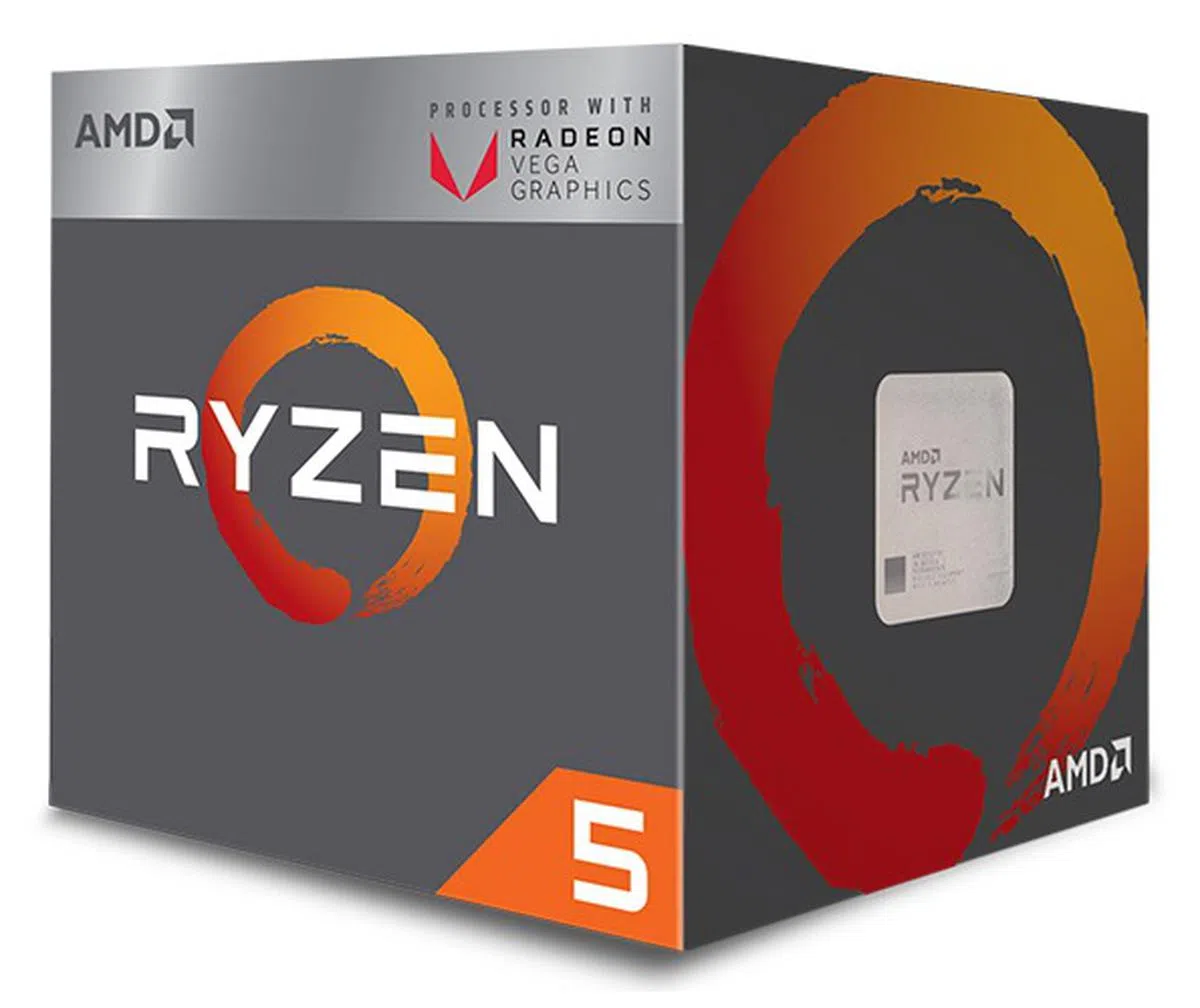
[hwzcompare]
[products=647225,630941,647213,647216,647219,647222]
[width=200]
[caption=Test CPUs compared]
[showprices=1]
[/hwzcompare]
Here's a list of the benchmarks used:
- SYSmark 2014 SE
- SPECviewperf 13.0
- Cinebench R15
- Handbrake 1.0.7
- 3DMark
- Ashes of the Singularity: Escalation
- Deus Ex: Mankind Divided
Performance results
SYSmark 2014 SE
SYSmark is a general productivity benchmark suite that measures the response times of tasks on a PC using real-world applications like Microsoft Office 2013 and Adobe Photoshop and simulated user input. Task response times are used to generate a performance rating that reflects actual user experience, so the faster a PC responds to application workloads, the higher its score will be. The method of measuring response times can take many forms, such as the time it takes for an application to show a pop-up completion message, or how long it takes a progress dialog to disappear and for a user to regain application control.
The 2014 SE version of SYSmark adds a new Responsiveness usage model, where the system's ability to react quickly to user input affects the overall user experience. This means situations where the system needs to respond smoothly and quickly, such as with application launches, multi-tab web browsing, file copying, and background app installation.
The flagship Ryzen 7 2700X edged ahead here. It had the highest base clock and a total of 8 cores and 16 threads, so this result isn't surprising. A look at the score breakdown shows that the differences are the most stark in media creation and data/financial analysis, where higher core and thread counts help it handle the more heavily threaded workloads.
In comparison, there were smaller differences in the office productivity workloads, which comprise more basic applications that don't require strong multi-threaded performance and focus more on clock speeds instead. After all, it's telling that the Ryzen 7 2700X was 20 per cent faster than the Ryzen 5 2400G in terms of office productivity but a good 42 per cent ahead for data/financial analysis.


SPECviewperf 13.0
SPECviewperf is used to assess the 3D graphics performance of systems in professional applications. Each individual workload, called a viewset, represents graphics and content from an actual real-world application. SPECviewperf actually runs a total of eight different viewsets, but we’ve picked the four which have the greatest performance variation across CPUs display here.
The new SPECviewperf 13 incorporates new models and raycasting for volume visualization. Select viewsets have also been updated with new models and fresh application traces.
SPECviewperf 13 doesn't seem to scale well beyond six cores, and the Pinnacle Ridge chips all performed very closely to each other.

Cinebench R15
Cinebench R15 is a better indicator of multi-threaded performance because of its ability to utilize up to 256 threads to evaluate a processor’s performance in a photorealistic 3D rendering. We ran both single-core and multi-core benchmarks to evaluate single-threaded performance and multi-threaded scalability here.
It's here that a high number of cores and threads really shine, and the Ryzen 7 2700X outstripped even the Ryzen 2700 by a good 16 per cent.

Handbrake 1.0.7
Handbrake is a video transcoder that converts videos into a format for use on PCs and portable electronic devices, and is a good indicator of a processor’s video encoding capabilities. YouTube content creators, Twitch streamers, and other video creators will be most interested in this performance metric. For this benchmark, we used a 1.7GB .mkv file.
The Raven Ridge APUs don't even come close to challenging the Pinnacle Ridge chips, which isn't surprising given that they're designed for more basic productivity tasks. However, if you're looking to get into streaming or work extensively with video, you'll see an obvious benefit in shelling out for the flagship Ryzen 2700X.

Temperature and power consumption
To test temperature and power consumption, we ran the AIDA64 Extreme CPU stress test and the energy-02 viewset in SPECviewperf 13.0 respectively, taking note of the peak values the chips achieved. For power consumption, this refers to the total system power draw from the power outlet.
It’s impossible to directly compare temperatures across all the chips given that we used different coolers for the Pinnacle Ridge and Raven Ridge chips, so these figures are better taken as a rough indicator to the temperatures you can expect under load.
Despite its higher 105W TDP, the Ryzen 7 2700X didn't in fact draw more power than the other chips at stock settings.


Gaming benchmarks and overclocking
We've outfitted the Ryzen Pinnacle Ridge processors with a GeForce GTX 1080 Ti GPU since they don't have integrated graphics and for the Ryzen Raven Ridge processors, we've opted to run them using their Radeon Vega IGP. Obviously, the gaming results aren't directly comparable but the prospective buyer isn't going to buy a Ryzen Raven Ridge and use discrete graphics anyway. Hence our results will show you the best of what the Ryzen 2 can handle with discrete graphics, as well as how the Raven Ridge Ryzen manages out of the box to pander to the two different usergroups.
3DMark
The synthetic 3DMark benchmark tests graphics and computational performance at different resolutions, starting at 1080p and going all the way up to 4K. A series of two graphics test, one physics test, and then a combined test stresses your hardware in turn to assess its performance. And because of the physics test that keeps the GPU load low while running gameplay physics simulations on the CPU, all three 3DMark Fire Strike tests scores also include an element of CPU performance.
We’ve also teased out the Physics and CPU scores for the Fire Strike and Time Spy tests and compiled them in separate tables to give a better idea of how each processor performed.
The differences among the chips is greatest at the less demanding 1080p Fire Strike test, where the CPU is the limiting factor. As you move to the more graphically taxing resolutions where the GPU becomes a limiting factor, the differences between the Pinnacle Ridge chips practically disappear.


Ashes of the Singularity: Escalation
Ashes of the Singularity is one of the few CPU-bound games out there, if you’re playing on lower resolutions and settings that is. We've separated the results for Pinnacle Ridge and Raven Ridge here, running the latter at lower settings than usual. Most folks will probably run games at low settings anyway if they have an APU installed, but the biggest issue was that the game sometimes just refused to run at higher setings.
The results here mirror those in 3DMark, where CPU performance matters most at lower resolutions and settings. Still, it's worth pointing out that there's not a lot that separates the chips even at 1080p, and the Ryzen 7 2700X wound up being ahead of the Ryzen 7 2700 by roughly 10 per cent.
It looks like the Ryzen 7 2700's lower base clocks dragged it down, but performance was significantly improved in DirectX 12 mode, and all the Pinnacle Ridge chips enjoyed a nice boost.


Deus Ex: Mankind Divided
Mankind Divided places a heavier burden on the GPU than CPU, and that's reflected even at 1080p, where there wasn't a lot that separates the different processors.
Separately, the Ryzen 5 2400G deserves praise for producing a reasonably playable result at low settings.


Overclocking
We've not done manual overclocking this time around, focusing instead of the performance you get out of the box.
However, we also tested out the Precision Boost Overdrive feature that's available now to the Ryzen 7 2700X and Ryzen 5 2600X. AMD introduced this feature on its Threadripper 2 processors, and it is designed to provide a one-click boost to multi-threaded performance.
You can enable it easily in Ryzen Master, and it lets you retain intelligent features like Precision Boost 2 and XFR2. However, power and VRM current capacity limits have been raised to allow for a more aggressive implementation of Precision Boost 2.
That said, results were mixed here. The Ryzen 5 2600X netted a small 4 per cent boost, but the Ryzen 7 2700X barely inched forward. This doesn't bode well for manual overclocking, and you may not be able to get much more out of the chip in this area.

What do you want to do with your PC?

The Ryzen 7 2700X comes bundled with a Wraith Prism cooler. (Image Source: AMD)
AMD's made decent progress in the space of a year, working on its weakness in single-threaded performance and 1080p gaming while continuing to push its advantage in multi-threaded performance.
To recap, here's a look at the second-generation Ryzen lineup and their prices:
Cores/Threads | Base/Boost clock | L3 cache | TDP | Cooler | Price (SGD) | |
Ryzen7 2700X | 8/16 | 3.7GHz/4.3GHz | 16MB | 105W | Wraith Prism (LED) | $485 |
Ryzen7 2700 | 8/16 | 3.2GHz/4.1GHz | 16MB | 65W | Wraith Spire (LED) | $448 |
Ryzen 5 2600X | 6/12 | 3.6GHz/4.2GHz | 16MB | 95W | Wraith Spire | $335 |
Ryzen5 2600 | 6/12 | 3.4GHz/3.9GHz | 16MB | 65W | Wraith Stealth | $292 |
Cores/Threads | Base/Boost Frequency | Graphics Model | Graphics Core Count | Max. GPU Clock | L2/L3 cache | TDP | Price (SGD) | |
Ryzen5 2400G | 4/8 | 3.6GHz/3.9GHz | Radeon Vega 11 Processor Graphics | 11 | 1,250MHz | 6MB | 65W | $234 |
Ryzen 3 2200G | 4/4 | 3.5GHz/3.7GHz | Radeon Vega 8Processor Graphics | 8 | 1,100MHz | 6MB | 65W | $144 |
It's easiest to say who the Ryzen 5 2400G and Ryzen 3 2200G are for. At S$234 and S$144 respectively, they'll appeal to budget-conscious users looking to build an entry-level machine with modest gaming capabilities. The integrated Vega graphics means that you can save on the cost of a dedicated GPU, so you could even shell out a bit more for the more powerful Ryzen 5 2400G.
However, anyone looking to build a system that can game at higher settings, stream, or even work with photo and video editing will probably look toward the Pinnacle Ridge processors. As with all things, it comes down to a matter of price. A mere S$40 separates the Ryzen 7 2700 from the 2700X, so it seems like it makes sense to pony up for the 2700X with its higher base and boost clocks. Furthermore, the significantly lower 3.2GHz base clock on the Ryzen 7 2700 also hurts it in certain workloads that are sensitive to clock speeds.
The same goes for the Ryzen 5 2600X and 2600, where I'd argue that the price difference isn't large enough to warrant settling for the lower-end model. To put things simply, if you're looking at a Pinnacle Ridge processor, just go straight for an X-series model. They don't cost much more, and you get a nice performance boost from technologies like XFR2.
All told, AMD has done an impressive job with its second-generation Ryzen processors. It's closed the gap in IPC performance, as evinced by the single-threaded scores in Cinebench. The Intel Core i7-8700K is around 12 per cent faster than the Ryzen 7 2700X in the latter benchmark, but the 2700X is further ahead in multi-threaded performance, with a whopping 24 per cent advantage.
There's decent value to be had with them as well, and each of them come bundled with a stock cooler that looks better than Intel's own offering. What's more, the Wraith Prism and Wraith Spire even come with built-in RGB lighting.
In other words, if you want a PC that is reasonably competent at a wide range of tasks including gaming, video encoding, and streaming, look toward the Ryzen 5 2600X or Ryzen 7 2700X if you've the budget for it.
 | |
 | |
 | |
 | |
 | |
 |


